. 2015 Dec;23(4):733-52.
doi: 10.1007/s10577-015-9479-3. Epub 2015 Jul 19.

Two novel DXZ4-associated long noncoding RNAs show developmental changes in expression coincident with heterochromatin formation at the human (Homo sapiens) macrosatellite repeat

Affiliations

Two novel DXZ4-associated long noncoding RNAs show developmental changes in expression coincident with heterochromatin formation at the human (Homo sapiens) macrosatellite repeat

Debbie M Figueroa et al. Chromosome Res. 2015 Dec.

Abstract

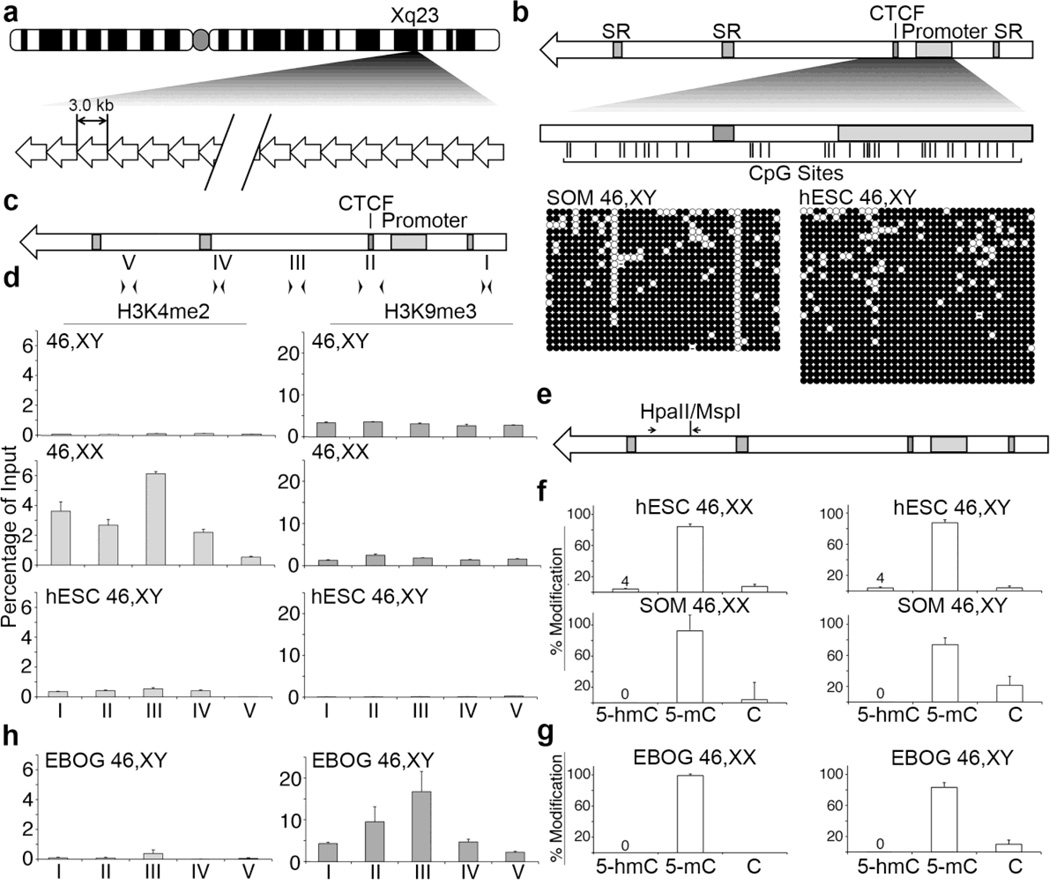
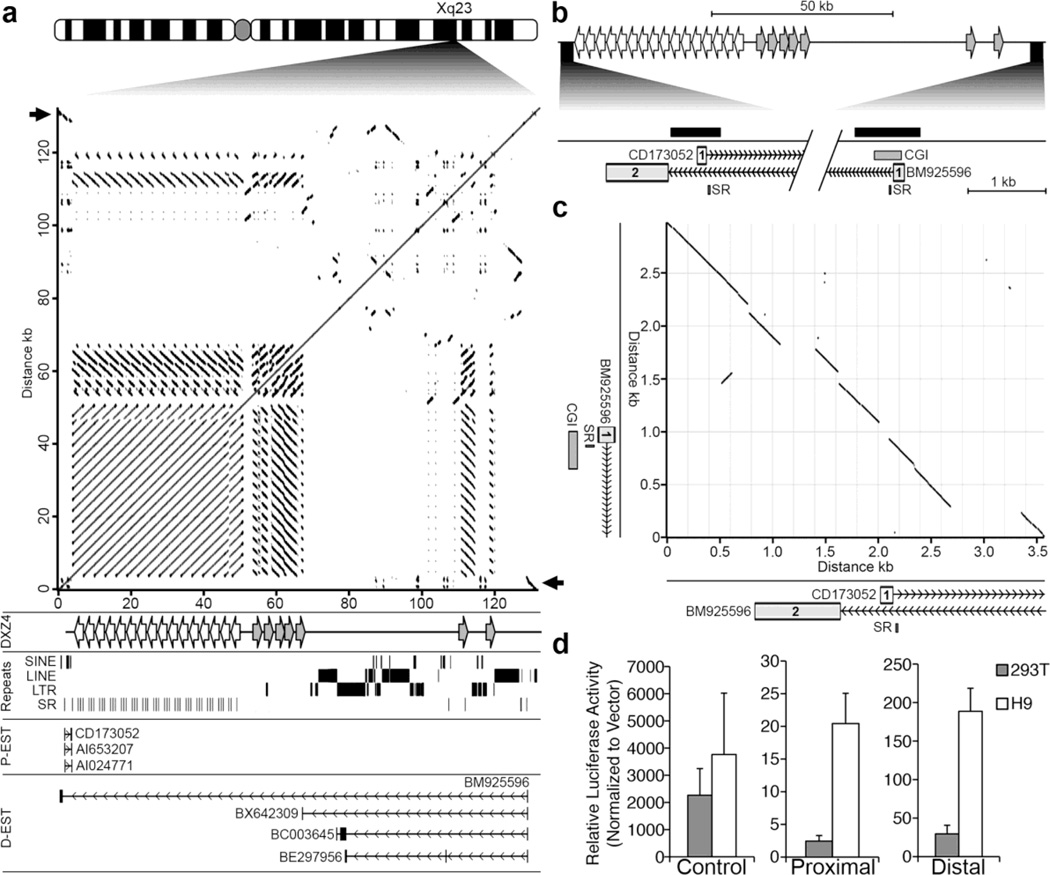
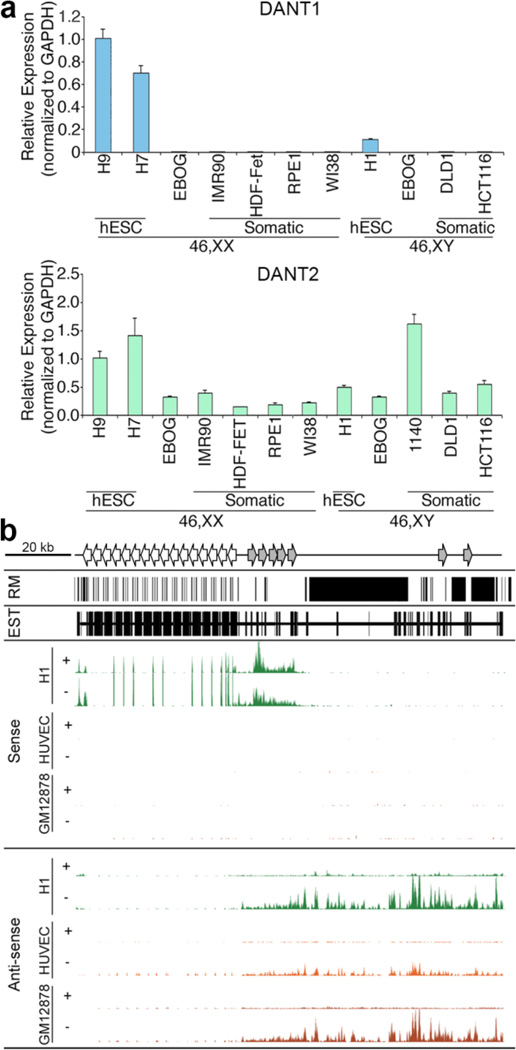
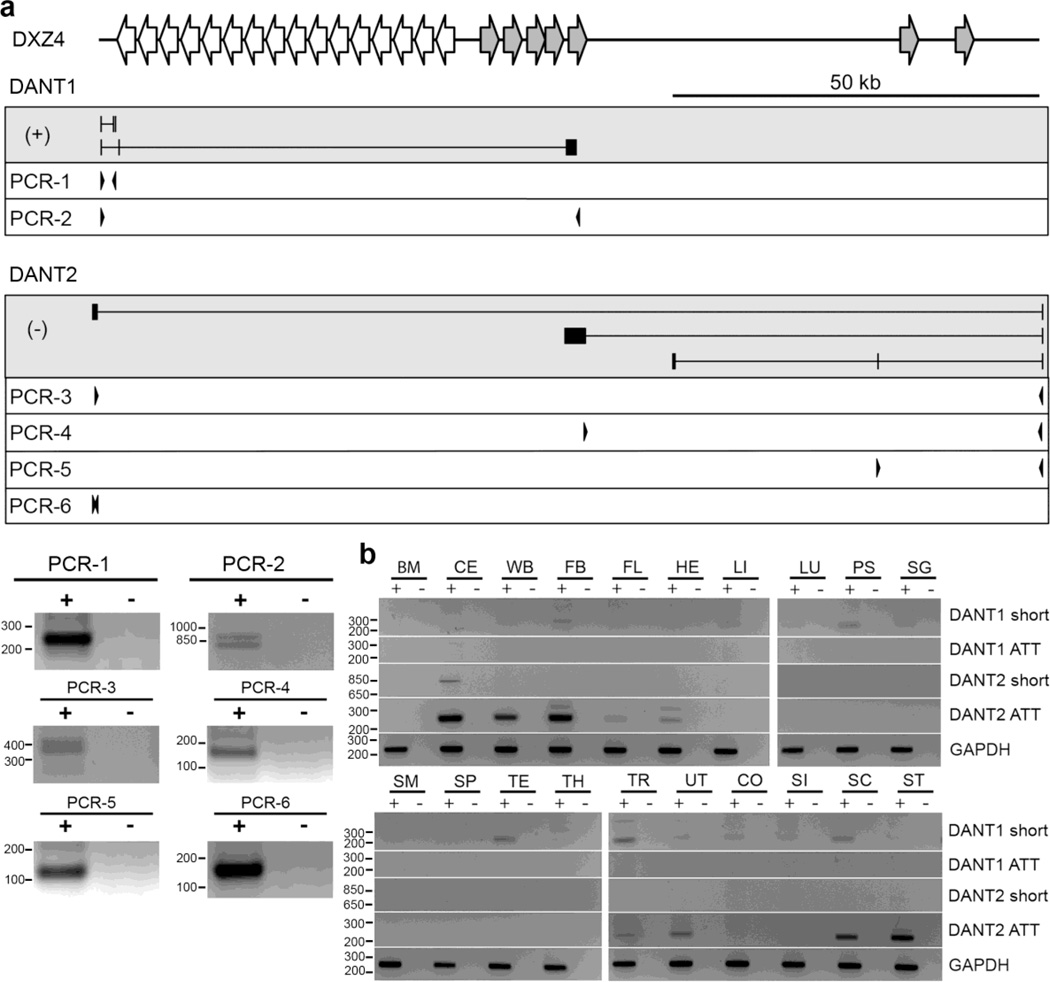
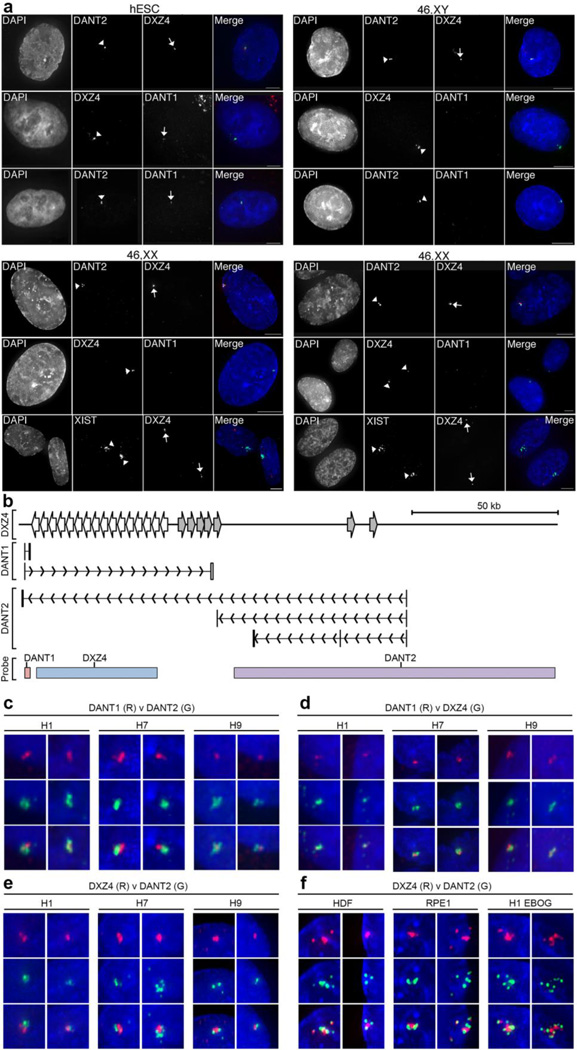
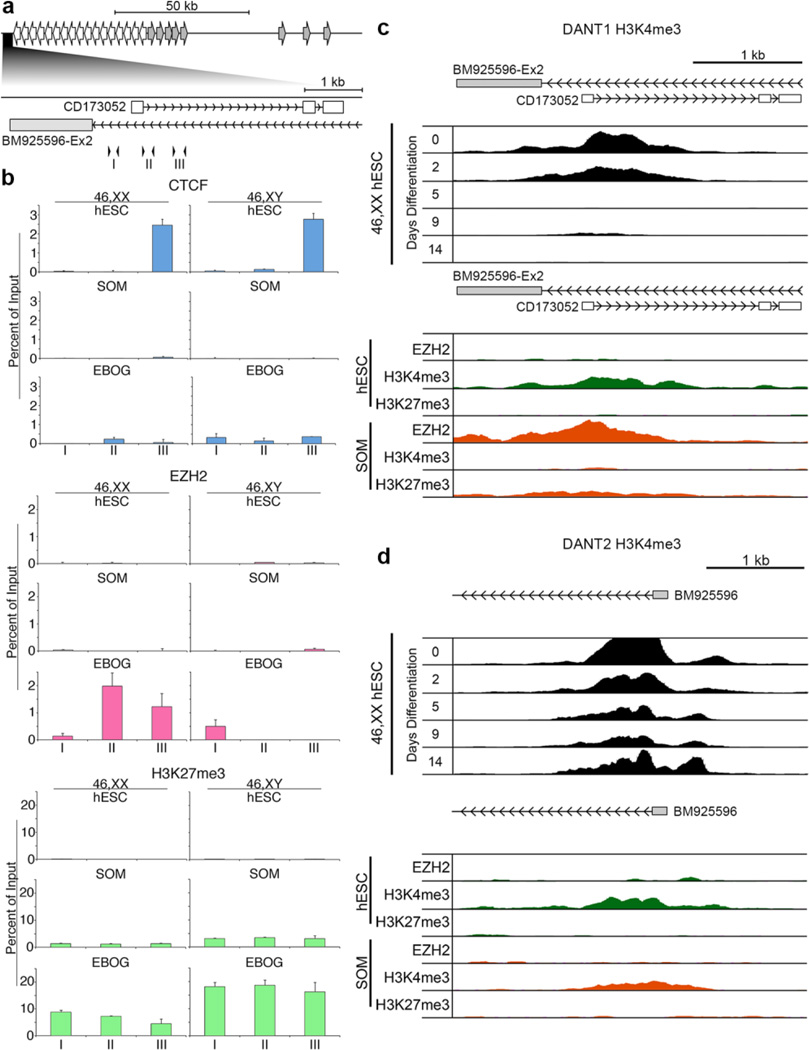
On the male X and female active X chromosome (Xa), the macrosatellite repeat (MSR) DXZ4 is packaged into constitutive heterochromatin characterized by CpG methylation and histone H3 tri-methylated at lysine-9 (H3K9me3). In contrast, DXZ4 on the female inactive X chromosome (Xi), is packaged into euchromatin, is bound by the architectural protein CCCTC-binding factor, and mediates Xi-specific long-range cis contact with similarly packaged tandem repeats on the Xi. In cancer, male DXZ4 can inappropriately revert to a Xi-like state and other MSRs have been reported to adopt alternate chromatin configurations in response to disease. Given this plasticity, we sought to identify factors that might control heterochromatin at DXZ4. In human embryonic stem cells, we found low levels of 5-hydroxymethylcytosine at DXZ4 and that this mark is lost upon differentiation as H3K9me3 is acquired. We identified two previously undescribed DXZ4 associated noncoding transcripts (DANT1 and DANT2) that are transcribed toward DXZ4 from promoters flanking the array. Each generates transcript isoforms that traverse the MSR. However, upon differentiation, enhancer of Zeste-2 silences DANT1, and DANT2 transcription terminates prior to entering DXZ4. These data support a model wherein DANT1 and/or DANT2 may function to regulate constitutive heterochromatin formation at this MSR.

Keywords: DXZ4; Euchromatin and heterochromatin; Human embryonic stem cells; Long noncoding RNA; Macrosatellite; X chromosome inactivation.


Conflict of interest statement

Conflict of Interest

The author Debbie M. Figueroa declares they have no conflict of interest.

The author Emily M. Darrow declares they have no conflict of interest.

The author Brian P. Chadwick declares they have no conflict of interest.

This article does not contain any studies with human or animal subjects performed by any of the authors.

Figures

Fig. 1
Fig. 1. Chromatin characterization in pluripotent and differentiated hESC
(a) Ideogram of the human X chromosome indicating Xq23 and the location of DXZ4. A schematic representation of DXZ4 is shown beneath the ideogram, composed of 12–120 copies of the 3 kb repeat unit. (b) Schematic representation of a single DXZ4 monomer (top). Annotated features (shaded boxes) include simple repeats (SR), the CTCF binding site and the internal promoter. The region assessed by Bisulfite Sequencing (BiS) analysis is expanded immediately below, and vertical lines indicate the locations of all 36 CpG residues. The BiS profiles for male somatic fibroblasts (1139; SOM 46,XY), and male hESCs (H1; hESC 46,XY) are shown immediately below. The black (methylated) and white (unmethylated) circles indicate methylation status, while each horizontal row is the BiS profile from a single clone. A sequence that has diverged and is no longer a CpG is indicated by a dash. (c) Schematic DXZ4 monomer showing the location of primer sets used for qChIP: I (F6.R20), II (F23.R14), III (F17.R8), IV (F11.R22) and V (F4.R19). (d) qChIP data for H3K4me2 (left) and H3K9me3 (right) at DXZ4 for male (46,XY) and female (46,XX) somatic cells, and male hESCs (hESC 46,XY). Each data set is graphed as a percent of input. Error bars indicate standard deviation from the mean of triplicate qPCR reactions from two or more replicate ChIP experiments. (e) DXZ4 schematic indicating the location of the CpG that is part of a HpaII/MspI recognition site and the location of primers used for qRT-PCR. (f) Graphs showing the quantitation of percent 5-hmC, 5-mC, and C at the HpaII/MspI site. Female samples (46,XX) are shown on the left and include H9 (hESC) and IMR90 (SOM), whereas male samples (46,XY) are indicated on the right and include H1 (hESC) and 1140 (SOM). Data shown is from three independent biological replicates. (g) Quantitation of percent 5-hmC, 5-mC, and C at the HpaII/MspI site in female H9 (left) and male H1 (right) EBOG. (h) Graphs showing qChIP data as in part-(D) above, but for EBOG derived from male hESC (EBOG 46,XY).
Fig. 2
Fig. 2. Related promoters flanking DXZ4 drive transcription toward the array
(a) Ideogram of the human X chromosome with the location of DXZ4 at Xq23 expanded. Beneath the ideogram is a pair-wise alignment of the DXZ4 interval corresponding to nucleotides 114,955,568 bp to 115,088,136 bp (hg19) adapted from the output of the Basic Local Alignment Search Tool at NCBI (http://blast.ncbi.nlm.nih.gov/Blast.cgi) with the align two or more sequence option. The black arrows point to the region of inverted homology that is the focus of part-C (described below). Immediately beneath, is indicated (DXZ4) the location of the main DXZ4 array (left-facing white arrows) as well as the DXZ4-related inverted repeats (right-facing grey arrows), followed by the location of repeat classes (Repeats), annotated ESTs or mRNAs originating proximal to DXZ4 (P-EST) that are transcribed from left to right, and distal ESTs (D-EST) that are transcribed from right to left. Vertical lines represent exons, and horizontal lines represent introns with chevrons indicating direction of transcription. Each EST or mRNA was extracted from data contained in the Human mRNAs and Spliced ESTs annotations on the UCSC Genome Browser. (b) Schematic map of the DXZ4 interval, with the region corresponding to the beginning of the proximal and distal ESTs expanded immediately below. Exon-1 of proximal EST CD173052 is shown (“1” containing white-box), as are exons 1 and 2 of BM925596 (grey boxes containing “1” and “2”, respectively). The locations of a conserved simple repeat (SR) and a CpG island (CGI) are also shown while the solid black bars indicate the locations of the genomic fragments cloned and used to assess for promoter activity in part-D (described below). The diagonal break corresponds to the genomic DNA between the candidate promoters. (c) Pair-wise alignment of the DNA sequence around exon-1 of the proximal ESTs to exon-1 of the distal ESTs, corresponding to nucleotides 114,955,273–114,958,855 (proximal region – x-axis) and 115,084,395–115,087,382 (distal region – y-axis) of the human X chromosome (hg19). An expansion of the schematic map from B corresponding to the x and y-axis are beneath and left of the alignment. (d) Relative promoter activity for the Proximal and Distal promoter candidate sequences as assessed in hESCs (H9) and 293T cells. Firefly luciferase activity is normalized to that of a constitutively active co-transfected Renilla luciferase construct, and is graphed relative to activity detected from a promoter-less vector. Data shown represents the mean of three separate transfection experiments performed in triplicate and error bars indicate standard deviation. Data for the Control sample was derived from a construct containing a strong promoter and enhancer as a positive control.
Fig. 3
Fig. 3. Characterization of the DANT1 and DANT2 lncRNAs
(a) Graphs showing the expression of DANT1 (top) and DANT2 (bottom) lncRNA as determined by qRT-PCR in the various samples indicated. Primers used for qRT-PCR were contained within exon-1 of each gene amplifying a 57 bp or 100 bp amplicon, respectively (Supplementary Table 1). Data represents the mean of triplicate qPCR reactions and error bars indicate standard deviation. qRT-PCR data is normalized to GAPDH levels and graphed relative to expression in a female hESC sample (H9). (b) Genomic interval chrX:114,955,242–115,088,266 (hg19) showing the extent of repeat masked (RM) DNA, the location of all ESTs, and the RNA-seq data for the DXZ4 interval showing strand-specific sequencing for male hESC (H1), male umbilical vein endothelial cells (HUVEC) and female EBV transformed B-lymphocytes (GM12878) (Parkhomchuk et al. 2009). The location of the main DXZ4 array is represented at the top by the left-facing arrows, whereas the approximate location of inverted homologous DXZ4 monomers are represented by gray right-facing arrows. Sense-strand data is shown at the top, representing transcription from left-to-right, and anti-sense data is on the bottom, representing transcription from right-to-left. The “+” and “−” represent data from polyA+ and polyA- RNA sources, respectively. For each profile the y-axis is from 0–300 reads.
Fig. 4
Fig. 4. Validation of the DANT1 and DANT2 short and array-traversing transcripts (ATT)
(a) Schematic map of the DXZ4 interval is shown at the top. Immediately below are maps of the transcripts in the grey-boxes with (+) or (−) indicating origins from the forward or reverse strand respectively. Primers used for RT-PCR’s 1–6 are shown beneath in the white boxes. Vertical lines represent exons and introns are horizontal lines. Representative RT-PCR results for PCR-1 through PCR-6 are shown as inverted ethidium bromide stained gel images. (b) Detection of DANT1 and DANT2 ATT and short transcripts in a variety of human tissues by RT-PCR, using the oligos described in Supplemental Table T1. The “+” and “−” for each sample indicate with and without reverse transcriptase, respectively. Sample key: bone marrow (BM), cerebellum (CE), whole brain (WB), fetal brain (FB), fetal liver (FL), heart (HE), liver (LI), lung (LU), prostate (PS), salivary gland (SG), skeletal muscle (SM), spleen (SP), testis (TE), thymus (TH), trachea (TR), uterus (UT), colon (CO), small intestine (SI), spinal cord (SC) and stomach (ST). Each is an inverted image of an ethidium bromide stained gel. Molecular weight marker sizes are indicated to the left of each gel image and are in bp.
Fig. 5
Fig. 5. RNA FISH Images showing allele-specific expression and spatial arrangement of DXZ4-associated lncRNAs
(a) Detection of DANT1DANT2 and DXZ4 by direct-labeled RNA FISH probes in male H1 (hESC) and various male (1140: 46,XY) and female (46,XX: HDF-FET – left panel and RPE1 – right panel) somatic cells. For each sample column 1 shows nuclei counterstained with DAPI (white), column 2 shows labeled signals indicated by arrowheads. Column 3 shows signals highlighted by arrows. Column 4 consists of a merge of the DAPI-staining (blue) with direct-RNA FISH in columns 2 (green) and 3 (red). The white bars at the bottom right of the merged images indicate 5µm. In female somatic cell samples, the location of the Xi is defined by XIST RNA FISH. (b) Schematic map of the interval around DXZ4, indicating the location of short and ATT DANT1 and DANT2 transcriptional units. The location of probes used for RNA FISH is indicated at the bottom. The DANT1 probe is a cloned genomic fragment corresponding to DANT1-short exons 1–3, DXZ4 is BAC clone 2272M5 and DANT2 is BAC clone 761E20. Panels (c–f) show RNA hybridization signals for the direct-labeled FISH probes indicated (DANT1, DANT2 or DXZ4) labeled in red (R) or green (G) merged with DAPI staining of the nucleus (blue). Cell lines include male (H1) and female (H7 and H9) hESCs as well as H1 derived EBOG and female somatic fibroblasts (HDF) or epithelial (RPE1) cells. Overlapping signals appear yellow. Two representative examples are shown for each probe combination used on the various cell types. Each image is approximately 1µm across.
Fig. 6
Fig. 6. Chromatin organization and dynamics around the DANT1 and DANT2 promoters
(a) Schematic map of the DXZ4 interval indicating the relative location of the DANT1 promoter. Immediately below this, the DANT1 region is expanded, corresponding to 114,956,035–114,959,533 bp of chromosome X (hg19) and the location of the short DANT1 EST (CD173052) and DANT2 ATT exon (BM925596-Ex2) are indicated. Inverted arrowheads correspond to the location of qChIP primer sets I (F1.R1), II (F2.R2) and III (F3.R3). (b) qChIP data for CTCF, EZH2, and H3K27me3. Each is graphed as a percent of input and is the mean of triplicate qPCR reactions. Error bars indicate standard deviation. Female (46,XX) data sets are on the left with male (46,XY) on the right. For each ChIP target, the top row shows data for female (H9) and male (H1) hESCs, middle row for female (RPE1) and male (BJ1) somatic cells and bottom row for EBOGs derived from the corresponding hESCs. (c) A map showing the location of DANT1 short EST (CD173052) and DANT2 ATT (BM925596-Ex2) corresponding to 114,956,077–114,959,451 bp of the X chromosome (hg19) is shown at the top. Immediately beneath this is publicly available H3K4me3 ChIP-seq data for H7 hESCs (46,XX hESC) prior to (day-0) and at various days post-differentiation (days 2–14) (Consortium et al. 2012). Below this is publicly available ChIP-seq data from the same interval for EZH2, H3K4me3 and H3K27me3 in male H1 (hESC) and male HUVEC somatic (SOM) cells (Consortium et al. 2012). (d) As in part-(c) above, but for DANT2 and interval 115,083,137–115,086,987 of the X chromosome (hg19).

Similar articles

Cited by

References

    1. Awaya T, Kato T, Mizuno Y, et al. Selective development of myogenic mesenchymal cells from human embryonic and induced pluripotent stem cells. PLoS One. 2012;7(12):e51638. - PMC - PubMed
    1. Booth MJ, Branco MR, Ficz G, et al. Quantitative sequencing of 5-methylcytosine and 5-hydroxymethylcytosine at single-base resolution. Science. 2012;336(6083):934–937. - PubMed
    1. Branco MR, Ficz G, Reik W. Uncovering the role of 5-hydroxymethylcytosine in the epigenome. Nat Rev Genet. 2012;13(1):7–13. - PubMed
    1. Brockdorff N, Ashworth A, Kay GF, et al. The product of the mouse Xist gene is a 15kb inactive X-specific transcript containing no conserved ORF and located in the nucleus. Cell. 1992;71:515–526. - PubMed
    1. Brown CJ, Hendrich BD, Rupert JL, et al. The human XIST gene: analysis of a 17 kb inactive X-specific RNA that contains conserved repeats and is highly localized within the nucleus. Cell. 1992;71:527–542. - PubMed

Publication types

LinkOut - more resources