. 2015 Jun 29;10(6):e0124638.
doi: 10.1371/journal.pone.0124638. eCollection 2015.

Proteomics and Transcriptomics of BJAB Cells Expressing the Epstein-Barr Virus Noncoding RNAs EBER1 and EBER2

Affiliations

Proteomics and Transcriptomics of BJAB Cells Expressing the Epstein-Barr Virus Noncoding RNAs EBER1 and EBER2

Genaro Pimienta et al. PLoS One. .

Abstract

In Epstein-Barr virus (EBV) latent infection, the EBV-encoded RNAs EBER1 and EBER2 accumulate in the host cell nucleus to ~10(6) copies. While the expression of EBERs in cell lines is associated with transformation, a mechanistic explanation of their roles in EBV latency remains elusive. To identify EBER-specific gene expression features, we compared the proteome and mRNA transcriptome from BJAB cells (an EBV-negative B lymphoma cell line) stably transfected with an empty plasmid or with one carrying both EBER genes. We identified ~1800 proteins with at least 2 SILAC pair measurements, of which only 8 and 12 were up- and downregulated ≥ 2-fold, respectively. One upregulated protein was PIK3AP1, a B-cell specific protein adapter known to activate the PI3K-AKT signaling pathway, which regulates alternative splicing and translation in addition to its pro-survival effects. In the mRNA-seq data, the mRNA levels for some of the proteins changing in the SILAC data did not change. We instead observed isoform switch events. We validated the most relevant findings with biochemical assays. These corroborated the upregulation of PIK3AP1 and AKT activation in BJAB cells expressing high levels of both EBERs and EBNA1 (a surrogate of Burkitt's lymphoma EBV latency I) relative to those expressing only EBNA1. The mRNA-seq data in these cells showed multiple upregulated oncogenes whose mRNAs are enriched for 3´-UTR AU-rich elements (AREs), such as ccl3, ccr7, il10, vegfa and zeb1. The CCL3, CCR7, IL10 and VEGFA proteins promote cell proliferation and are associated with EBV-mediated lymphomas. In EBV latency, ZEB1 represses the transcription of ZEBRA, an EBV lytic phase activation factor. We previously found that EBER1 interacts with AUF1 in vivo and proposed stabilization of ARE-containing mRNAs. Thus, the ~10(6) copies of EBER1 may promote not only cell proliferation due to an increase in the levels of ARE-containing genes like ccl3, ccr7, il10, and vegfa, but also the maintenance of latency, through higher levels of zeb1.


Conflict of interest statement

Competing Interests: The authors have declared that no competing interests exist.

Figures

Fig 1
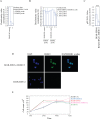
Fig 1. Expression levels of EBER1 and EBER2 in BJAB cells.
(A) In BJAB-EBER1/2 cells (FRT), EBER1 and EBER2 are expressed to about one tenth of their levels found in EBV-infected BJAB cells (BJAB-B1) set to 1. The densitometry values are the average of three biological replicates. (B) BJAB cells stably transfected with the ppCEP4 vector containing four (4X), six (6X) or eight (8X) copies of the EcoRI-J fragment expressed similar levels of EBER1 and EBER2, compared to BJAB-B1 cells. The densitometry values are the average of three biological replicates. (C) qRT-PCR assays specific for ebna1 mRNA in BJAB-EBNA1 and BJAB-EBNA1-EBER1/2, compared to BJAB-B1 cells. (D) FISH image shows the consistent expression of EBER1 in the nucleus of BJAB-EBNA1-EBER1/2 cells. In (A-C) the values are normalized to actin (ACTB) as a control and the error bars reflect the standard deviation from three biological replicates. (E) Proliferation assays of BJAB cell lines. Cells were counted in triplicate every 24 hours.
Fig 2
Fig 2. SILAC ratios of the proteins identified.
Log2 SILAC ratios (BJAB-EBER1/2 vs BJAB-CTL) plotted against the number of proteins identified. Ratios with ≥ 1 SILAC pair count are colored blue and those with ≥ 2 counts red. Representative proteins upregulated are indicated.
Fig 3
Fig 3. SILAC proteomics and mRNA-seq transcriptomics.
(A) Cross-correlation of SILAC ratios (≥ 2 counts) and their corresponding total mRNA levels. The y-axis shows the Log2 values of the SILAC EBER/CTL ratio. The x-axis indicates for each SILAC ratio its corresponding Log2 total mRNA levels obtained by mRNA-seq. The mRNA values were averaged from the two biological replicates collected. Proteins with a significant SILAC ratio are indicated. Those with a significant fold-change in the mRNA-seq data are colored red. (B) Plots showing the cross-correlation between fold-changes (Log2 values) in the two biological replicates of each comparison: BJAB-EBER1/2 vs BJAB-CTL comparison (blue), BJAB-EBNA1-EBER1/2 vs BJAB-EBNA2 comparison (red).
Fig 4
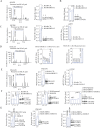
Fig 4. WB and qRT-PCR validation assays.
(A) Representative precursor ion SILAC pair MS spectra and WB assay for ADAD2 in the BJAB-EBER1/2 vs BJAB-CTL comparison. (B) WB assays showing the measured fold-changes for La and L22 in the BJAB-EBER1/2 vs BJAB-CTL comparison, which in our SILAC data do not change. (C) Representative precursor ion SILAC pair MS spectra for EIF2B4, plus the corresponding WB and qRT-PCR assays in the BJAB-EBER1/2 vs BJAB-CTL comparison. (D) Representative precursor ion SILAC pair MS spectra and WB assay for the FCRLA/1 protein group in the BJAB-EBER1/2 vs BJAB-CTL comparison. Total mRNA level fold-changes based on qRT-PCR assays for the family of FCRLs expressed in BJAB cells in the two indicated comparisons. (E) Representative precursor ion SILAC pair MS spectra for PIK3AP1, plus the corresponding WB and qRT-PCR assays in the BJAB-EBER1/2 vs BJAB-CTL comparison. (F) WB assays for total AKT and pAKT in the three indicated comparisons. In all panels, the WB densitometry and qRT-PCR bar plots are based on three independent biological replicates. Error bars indicate the standard deviation. In the qRT-PCR measurements, the values obtained were normalized to ACTB as a control. (G) WB assays using antibodies for ADAD2 and EIF2B4 in total cell lysates from 293T cells transiently transfected (24 hours) with a control plasmid (empty FRT) or one encoding the EBERs (FRT-EBER1/2). Also shown are the WB assays for PIK3AP1, ADAD2 and EIF2B4 in the BJAB-EBNA1-EBER1/2 vs BJAB-EBNA1 comparison. Error bars reflect the standard deviation of three biological replicates.
Fig 5
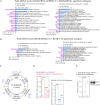
Fig 5. GO analysis and tumorigenic signature.
Using the DAVID web-based portal (http://david.abcc.ncifcrf.gov/), we performed a GO analysis of the two datasets (low and high EBER1/2 expression) based on the main PANTHER classification terms, Molecular Function (MF) and Biological Property (BP). (A) GO analysis of the BJAB-EBER1/2 vs BJAB-CTL comparison (low EBER1/2 expression levels). Right and left plots indicate the enrichment in MF and BP terms, respectively. (B) As in the previous panel, GO analysis of the BJAB-EBNA1-EBER1/2 vs BJAB-EBNA1 comparison (high EBER1/2 levels). (C) Figure adapted from Hanahan and Weinberg [37] to highlight the oncogenic signature enriched in BJAB-EBNA1-EBER1/2 cells. (D) qRT-PCR validation assays for il10, vegfa and zeb1 mRNAs from three biological replicates per comparison. The left plot shows an overlay of the BJAB-EBER1/2 vs BJAB-CTL (blue) and BJAB-EBNA1-EBER1-/2 vs BJAB-EBNA1 (red) fold-changes. The right plot shows the BJAB-B1 vs BJAB-parental fold-changes. All values were normalized to ACTB as a control. (E) WB assays with an antibody specific for ZEB1 in the BJAB-EBNA1-EBER1/2 vs BJAB-EBNA1 comparison. Densitometry values and error bars reflect three independent biological replicates.
Fig 6
Fig 6. Validation by qRT-PCR of zeb1 alternative isoform abundances in the BJAB-EBNA1-EBER1/2 vs BJAB-EBNA1 comparison.
(A) The cartoon shows the mRNA-seq paired-end reads aligned by TopHat to the zeb1 gene and indicates the alternative isoforms identified by Cufflinks in the bioinformatics analysis. The isoforms with a significant fold-change in the BJAB-EBNA1-EBER1/2 vs BJAB-EBNA1 comparison are colored blue. (B) Isoform abundances calculated by Cufflinks for each alternative isoform identified. The isoforms calculated to have changed significantly by Cufflinks are colored blue. (C) Validation by qRT-PCR of the indicated isoforms. The qRT-PCR values were normalized to 18S rRNA.
Fig 7
Fig 7. Validation by qRT-PCR of vegfa alternative isoform abundances in the BJAB-EBNA1-EBER1/2 vs BJAB-EBNA1 comparison.
(A) The cartoon shows the mRNA-seq paired-end reads aligned by TopHat to the vegfa gene and indicates the alternative isoforms identified by Cufflinks in the bioinformatics analysis. The isoforms with a significant fold-change in the BJAB-EBNA1-EBER1/2 vs BJAB-EBNA1 comparison are colored blue. (B) Isoform abundances calculated by Cufflinks for each alternative isoform identified. The isoforms calculated to have changed significantly by Cufflinks are colored blue. (C) Validation by qRT-PCR of the indicated isoforms. The qRT-PCR values were normalized to 18S rRNA.
Fig 8
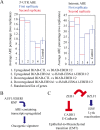
Fig 8. Enrichment of 3´-UTR AREs in the EBER-upregulated genes.
(A) Enrichment of ARE-containing transcripts in the up- or downregulated list of genes in all datasets. We performed the analysis using the ARED repository of 3´-UTR or intronic AREs [45] by comparing the percentage in each list of genes with that generated by a randomly-picked list of 256 genes (performed 5 times). For each comparison (low and high EBER expression), we plotted the mRNAseq-derived data values as blue and red bars corresponding to the first and second biological replicates, respectively. In the case of the random list (control lane), the error bars reflect the standard deviation of the 5 random gene lists. No ARE-containing genes were found in the list of downregulated genes of the second biological replicate of the BJAB-EBER1/2 vs BJAB-CTL comparison. This explains the absence of a red bar plot in this case. (B) The mRNA-seq data support our previous conclusion that the ~1 million molecules of EBER1 per cell may prevent AUF1 from destabilizing 3´-UTR ARE-containing mRNA substrates–many of which encode oncoproteins [10]. (C) ZEB1 is a well-known master switch of the EMT, typically associated with metastasis [43]. This switch is used by EBV to maintain latency upon infection [42]. Our data suggest the model that EBER1 in high enough amounts may induce the upregulation of ZEB1, providing positive regulation of latency maintenance and in some cases oncogenesis.

Similar articles

Cited by

References

    1. Young LS, Rickinson AB. Epstein-Barr virus: 40 years on. Nat Rev Cancer. 2004;4(10):757–68. - PubMed
    1. Thorley-Lawson DA, Allday MJ. The curious case of the tumour virus: 50 years of Burkitt's lymphoma. Nat Rev Microbiol. 2008;6(12):913–24. 10.1038/nrmicro2015 - DOI - PubMed
    1. Speck SH, Ganem D. Viral latency and its regulation: lessons from the gamma-herpesviruses. Cell Host Microbe. 2010;8(1):100–15. 10.1016/j.chom.2010.06.014 - DOI - PMC - PubMed
    1. Iwakiri D, Takada K. Role of EBERs in the pathogenesis of EBV infection. Adv Cancer Res. 2010;107:119–36. 10.1016/S0065-230X(10)07004-1 - DOI - PubMed
    1. Lerner MR, Andrews NC, Miller G, Steitz JA. Two small RNAs encoded by Epstein-Barr virus and complexed with protein are precipitated by antibodies from patients with systemic lupus erythematosus. Proc Natl Acad Sci U S A. 1981;78(2):805–9. - PMC - PubMed

Publication types

MeSH terms

LinkOut - more resources