. 2015 May 2;2(5):517-32.
doi: 10.18632/oncoscience.160. eCollection 2015.

Identification of artesunate as a specific activator of ferroptosis in pancreatic cancer cells

Affiliations

Identification of artesunate as a specific activator of ferroptosis in pancreatic cancer cells

Nils Eling et al. Oncoscience. .

Abstract

Oncogenic KRas reprograms pancreatic ductal adenocarcinoma (PDAC) cells to states which are highly resistant to apoptosis. Thus, a major preclinical goal is to identify effective strategies for killing PDAC cells. Artesunate (ART) is an anti-malarial that specifically induces programmed cell death in different cancer cell types, in a manner initiated by reactive oxygen species (ROS)-generation. In this study we demonstrate that ART specifically induced ROS- and lysosomal iron-dependent cell death in PDAC cell lines. Highest cytotoxicity was obtained in PDAC cell lines with constitutively-active KRas, and ART did not affect non-neoplastic human pancreatic ductal epithelial (HPDE) cells. We determined that ART did not induce apoptosis or necroptosis. Instead, ART induced ferroptosis, a recently described mode of ROS- and iron-dependent programmed necrosis which can be activated in Ras-transformed cells. Co-treatment with the ferroptosis inhibitor ferrostatin-1 blocked ART-induced lipid peroxidation and cell death, and increased long-term cell survival and proliferation. Importantly, analysis of PDAC patient mRNA expression indicates a dependency on antioxidant homeostasis and increased sensitivity to free intracellular iron, both of which correlate with Ras-driven sensitivity to ferroptosis. Overall, our findings suggest that ART activation of ferroptosis is an effective, novel pathway for killing PDAC cells.

Keywords: KRas; artesunate; cell death; ferroptosis; necroptosis; pancreatic cancer.


Conflict of interest statement

CONFLICTS OF INTEREST

The authors declare no conflict of interest.

Figures
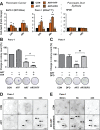
Figure 1
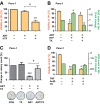
Figure 1. ART induces specific, iron-depended PCD in pancreatic cancer cell lines
A. BxPC-3, and Panc-1 pancreatic cancer and non-neoplastic HPDE epithelial cells were treated with ART (50 μM) alone or in combination with iron-saturated holo-transferrin (HTF, 20 μg/ml) or the iron chelator deferoxamine (DFO, 0.1 mM) for 24 or 48 hours. Following, cell death was assessed using the exclusion dye PI (1 μg/ml). Data is presented as fold-change in PI intensity relative to drug-free control conditions. Statistical significance was tested vs. cells treated under control conditions (*) or ART alone (#)(n = 3; #,*, p ≤ 0.05; **,##p ≤ 0.005). B. Panc-1 cells were subjected to ART, HTF, or ART and HTF. At 24 hours, 300 surviving cells were re-seeded for a colony formation assay. Colony count following 11 days of re-seeding is presented as fold change compared to control conditions. Statistical significance was tested vs. control (*) or ART alone (#) (n = 3-4; *,#, p ≤ 0.05; **,##, p ≤ 0.005). C. Panc-1 cells were subjected to ART, DFO, or ART and DFO for 24 hours. Following colony formation assays were performed and analyzed as in (B). D. Panc-1 cells were stained with Alexa Fluor Human Transferrin (HTF546, 5 μg/ml). Following, endolysosomal HTF546 was detected by fluorescence microscopy at 30 minutes, 6 hours and 24 hours fluorescence of exposure to ART or control conditions. Representative images of three independent experiments are shown. E, Panc-1 cells were pre-treated with ART or control conditions for 24 hours. Following, cells were stained with HTF546 and endolysosomal HTF546 fluorescence detected at 30 minutes, 6 and 24 hours. Representative images of three independent experiments are shown. Scale bars, 10 μm.
Figure 2
Figure 2. ART-induced, HTF-potentiated PDAC cell death is ROS-dependent
A. Panc-1 cells were exposed to ART alone or in combination with HTF. At 24 hours cells were stained with PI and analyzed by imaging-coupled flow cytometry. The percentages of PI-negative cells are presented, as an index of viability. Statistical significance was tested vs. control (*) or ART alone (#) (n = 5; #, p ≤ 0.05; **, p ≤ 0.005). B. Panc-1 cells were treated with ART and HTF, without and with addition of the antioxidant trolox (TX, 0.5 mM). At 24 hours, cell were stained with H2DCFDA and PI and analyzed by imaging-coupled flow cytometry. The percentage of PI-negative cells (viability) is shown (yellow bars). The mean DCF intensities of viable cells are presented normalized to control conditions (green bars). Statistical significance was tested vs. control (*) or ART alone (#) (n = 3; *,#, p ≤ 0.05). C. Colony formation assays were performed for cells exposed for 24 hours to ART or TX alone, or in combination. Colony count at 11 days post treatments is presented as fold change compared to control conditions. Statistical significance was tested vs. control (*) or ART alone (#) (n = 6; #, p ≤ 0.05; ***, p ≤ 0.001). D. Panc-1 cells were exposed to TNF (43 ng/ml) and ActD (1 μg/ml), without and with TX. At 24 hours, cell were stained with H DCFDA and PI and analyzed by imaging-coupled flow cytometry. The percentage of PI negative cells (viability), and mean DCF intensities of viable cells, normalized to control conditions, are presented. Statistical significance was tested vs. control (n = 3; *,#, p ≤ 0.05; **, p ≤ 0.005).
Figure 3
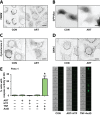
Figure 3. ART induces PDAC cell death in a non-apoptotic manner, independent of mitochondria- and caspase- mediated death signaling
A.-D. Panc-1 cells were treated without and with ART for 24 hours. A. Cells were stained with TMRM following treatments and inspected by fluorescence microscopy. B. Representative images of cells that had been transfected with GFP-Bax prior to treatments. C. Cells were fixed and immunostained for cytochrome c. D. Cells were fixed and immunostained for Smac. Scale bars, 10 μm. E. Panc-1 cells stably expressing the fluorescent caspase-3 sensor, GC3AI, were treated without and with ART alone, ART and HTF, TNF (43 ng/ml), or TNF and ActD (1 μg/ml) for 24 hours. Following, GFP-positive, caspase-3 active cells were detected using imaging-coupled flow cytometry. The percentages of GFP-positive, caspase-3 active cells (left) and representative images of cells (right) are presented. Statistical significance was tested vs. control (n = 3; *, p ≤ 0.05).
Figure 4
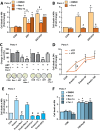
Figure 4. ART induces ferroptosis in Panc-1 cancer cells
A. Panc-1 cells were subjected to ART or ART/HTF with and without addition of Nec-1 (20 μM) or Nec-1s (20 μM) for 48 hours. Following, cells were stained with Yo-Pro-1 and analyzed using a fluorescence plate reader. Cell death is presented as fold change increase in Yo-Pro-1 intensity normalized to DMSO control. Statistical significance was tested vs. control (*), ART (#), or ART/HTF treatment (§) (n = 3; *,#,§, p ≤ 0.05; **, p ≤ 0.005, ***, p ≤ 0.001). B. Panc-1 cells were treated with ART or ART/HTF without or with Fer-1 (20 μM) for 48 hours. Cell death was measured by Yo-Pro-1 fluorescence detection and is presented as fold change increase in Yo-Pro-1 intensity normalized to DMSO control. Statistical significance was tested vs. control (*), ART (#), or ART/HTF treatment (§) (n = 3; *,#,§, p ≤ 0.05). C. Colony formation assays were performed with Panc-1 cells subjected to Nec-1, Fer-1, or ART alone or ART in combination with Nec-1 or Fer-1. Colony count at 11 days post treatment is presented as fold change compared to control conditions. Statistical significance was tested vs. control (*) or ART treatment (#) (n = 3; *,#, p ≤ 0.05; ** p ≤ 0.005). D. Panc-1 cells were subjected to erastin (10-100 μM) without and with HTF for 24 hours. Cell death was measured by Yo-Pro-1 fluorescence detection and is presented as fold change increase in Yo-Pro-1 intensity normalized to control conditions. Statistical significance was tested vs. control (*), or 10 μM erastin (#) treatment (n = 3; *,#, p ≤ 0.05). E. Panc-1 cells were subjected to erastin (50 μM) alone or in combination with Nec-1, Nec-1s, Fer-1, TX, or DFO for 48 hours. Cell death was measured using Yo-Pro-1 and is presented as fold change in Yo-Pro-1 fluorescence intensity normalized to control conditions. Statistical significance was tested vs. control (*), or 50 μM erastin (#) treatment (n = 3; *,#, p ≤ 0.05). F. Panc-1 cells were subjected to TNF/ActD without or with Nec-1, Nec-1s, or Fer-1 for 48 hours. Cell death was measured with Yo-Pro-1 and is presented as fold change in Yo-Pro-1 fluorescence intensity normalized to control conditions. Statistical significance was tested vs. control treatment (n = 3; *, p ≤ 0.05; **, p ≤ 0.005).
Figure 5
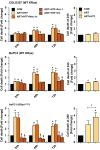
Figure 5. ART induces ferroptosis in a variety of pancreatic cancer cells
COLO357 (WT KRas), BxPC-3 (WT KRas), and AsPC-1 (KRasG12D) PC cells were treated with ART/HTF without and with Nec-1s, Fer-1 or TX for 24, 48, or 72 hours (left panel of graphs). In parallel, cells were subjected to ART alone and compared to ART/HTF treated cells (right panel of graphs, cell death of ART/HTF is the same value as in left panel). Cell death was measured by Yo-Pro-1 fluorescence detection and is presented as fold change increase in Yo-Pro-1 intensity normalized to control conditions. Statistical significance was tested vs. control (*), ART (#), or ART and HTF treatment (§) (n = 3; *,#,§, p ≤ 0.05).
Figure 6
Figure 6. Ferroptosis in Panc-1 cells is characterized by lipid peroxidation
A. Panc-1 cells were subjected to HTF, ART, or ART and HTF for 24 hours. Following, whole cell lysates were prepared and protein levels of Bach1 (92 kDa), and HO-1 (32 kDa) were detected via Western blotting. Graphs display quantified values, normalized to loading control GAPDH (37 kDa), and shown relative to control conditions. Statistical significance was tested vs. control conditions (n = 3; *, p ≤ 0.05, **, p ≤ 0.005). B. Panc-1 cells were treated with ART and HTF without and with Fer-1. At 24 hours, cells were stained with H DCFDA and PI prior to imaging-coupled flow cytometry. Percentage of PI negative cells (viability) as well as mean DCF intensity of viable cells normalized to control conditions are presented. Statistical significance was tested vs. control (*) or ART treatment (#) (n = 3; *,#, p ≤ 0.05). C. Panc-1 cells were seeded in 8-well microscopy μ-slides (iBidi) and exposed to ART alone or in combination with TX or Fer-1. At 24 hours, cells were stained with BODIPY C11 (581/591) and fluorescence of oxidized and reduced BODIPY C11 was detected. Lipid peroxidation is presented as single cell quantification of oxidized vs. reduced BODIPY C11 fluorescence intensity. 50 cells per condition were analyzed from three independent experiments. Statistical significance was tested vs. control (*), or ART (#) treatment (n = 3; ***, ###, p ≤ 0.001).
Figure 7
Figure 7. Analysis of patient gene expression data suggests PDAC in vivo sensitivity to ferroptotic signaling
Gene set analysis was performed using R2 platform (r2.amc.nl) on the dataset from Badea et al. [50]. Tumor samples are indicated by green boxes while normal tissue samples are presented as red boxes. Differential expression is calculated based on the zscore showing a up-regulation (red) and down-regulation (green) clustered in heatmaps. A. Differential mRNA expression of genes contained in the iron homeostasis gene set. Differential single gene expression of transferrin (TF), TF-receptor (TFRC) and ferritin light chain (FTL) are presented as box plots. Statistical significance was calculated between normal and tumor tissue (ANOVA; n = 39; *, p ≤ 0.05; **, p ≤ 0.005). B. Differential mRNA expression of genes contained in the glutathione/ROS homeostasis gene set. Differential single gene expression of glutathione peroxidase (GPX4) is presented as box plots. Statistical significance was calculated between normal and tumor tissue (ANOVA; n = 39; ***, p ≤ 0.001). C. Differential mRNA expression of genes contained in the extrinsic apoptosis gene set. Differential single gene expression of FAS and TNF-Receptor (TNFR) are presented as box plots. Statistical significance was calculated between normal and tumor tissue (ANOVA; n = 39; ***, p ≤ 0.001). D. Differential mRNA expression of genes contained in the intrinsic apoptosis gene set. Differential single gene expression of Bcl-xL (BCL2L1) are presented as box plots. Statistical significance was calculated between normal and tumor tissue (ANOVA; n = 39; ***, p ≤ 0.001). Additionally, box plots of expressed genes related to ferroptosis (CS, ACSF2, RPL8, EMC2, ATP5G3, and IREB2) are presented. Statistical significance was calculated between normal and tumor tissue (ANOVA; n = 39; *, p ≤ 0.05; ***, p ≤ 0.001).
Figure 8
Figure 8. Schematic overview of ferroptosis induction by ART in pancreatic cancer cells
PDAC cells carrying oncogenic Ras mutations undergo metabolic, antioxidant and anti-apoptotic adaptations, essential for cell survival. The antioxidant response counteracts toxic ROS and promotes cellular survival. ART interactions with lysosomal iron generates levels of ROS that overcome the capacity of the antioxidant response, leading to lipid peroxidation and ferroptotic cell death.

Similar articles

Cited by

References

    1. Burris HA, 3rd, Moore MJ, Andersen J, Green MR, Rothenberg ML, Modiano MR, Cripps MC, Portenoy RK, Storniolo AM, Tarassoff P, Nelson R, Dorr FA, Stephens CD, et al. Improvements in survival and clinical benefit with gemcitabine as first-line therapy for patients with advanced pancreas cancer: a randomized trial. J Clin Oncol. 1997;15(6):2403–2413. - PubMed
    1. Malvezzi M, Bertuccio P, Levi F, La Vecchia C Negri E. European cancer mortality predictions for the year. Ann Oncol. 2014:2014. - PubMed
    1. Almoguera C, Shibata D, Forrester K, Martin J, Arnheim N Perucho M. Most human carcinomas of the exocrine pancreas contain mutant c-K-ras genes. Cell. 1988;53(4):549–554. - PubMed
    1. Eser S, Schnieke A, Schneider G Saur D. Oncogenic KRAS signalling in pancreatic cancer. Br J Cancer. 2014;111(5):817–822. - PMC - PubMed
    1. DeNicola GM, Karreth FA, Humpton TJ, Gopinathan A, Wei C, Frese K, Mangal D, Yu KH, Yeo CJ, Calhoun ES, Scrimieri F, Winter JM, Hruban RH, et al. Oncogene- induced Nrf2 transcription promotes ROS detoxification and tumorigenesis. Nature. 2011;475(7354):106–109. - PMC - PubMed