. 2015 Jun 16;42(6):1021-32.
doi: 10.1016/j.immuni.2015.05.017.

The MicroRNA-132 and MicroRNA-212 Cluster Regulates Hematopoietic Stem Cell Maintenance and Survival with Age by Buffering FOXO3 Expression

Affiliations

The MicroRNA-132 and MicroRNA-212 Cluster Regulates Hematopoietic Stem Cell Maintenance and Survival with Age by Buffering FOXO3 Expression

Arnav Mehta et al. Immunity. .

Abstract

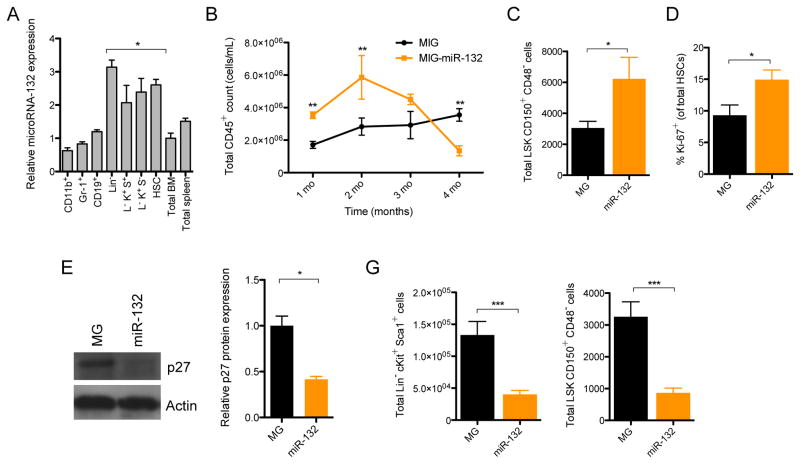
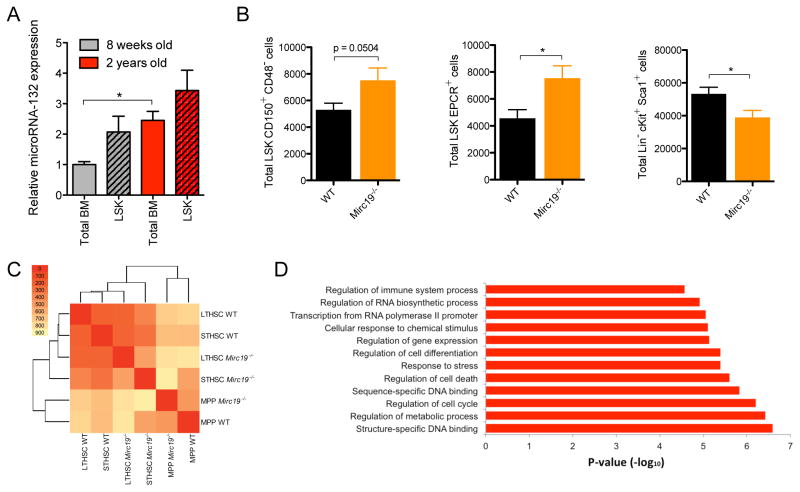
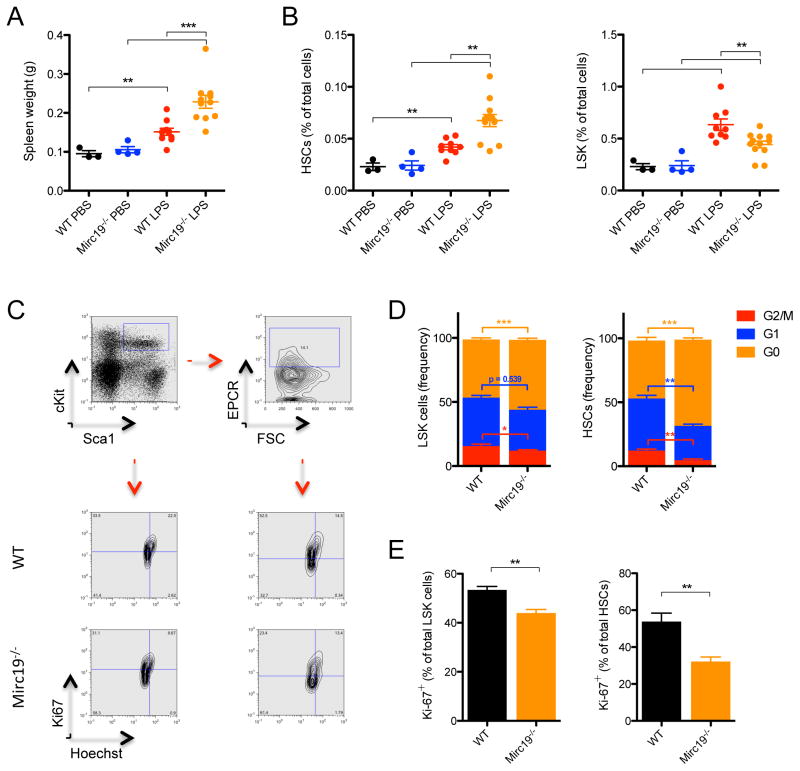
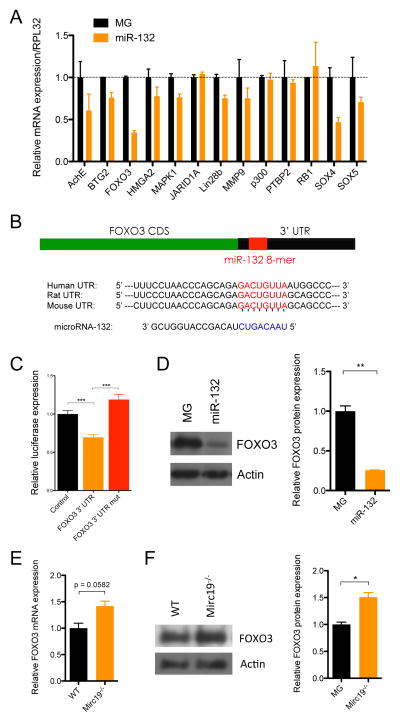
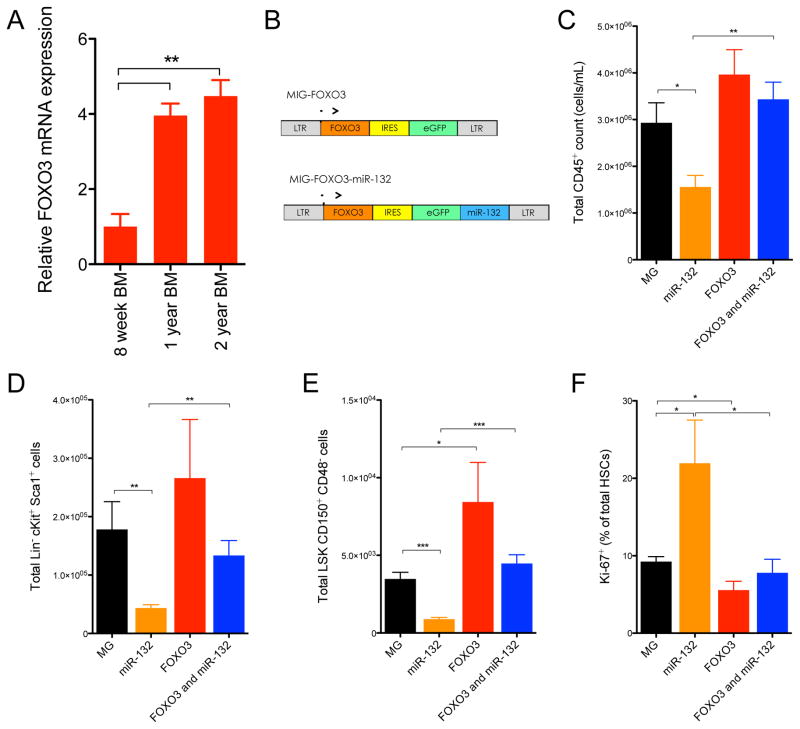
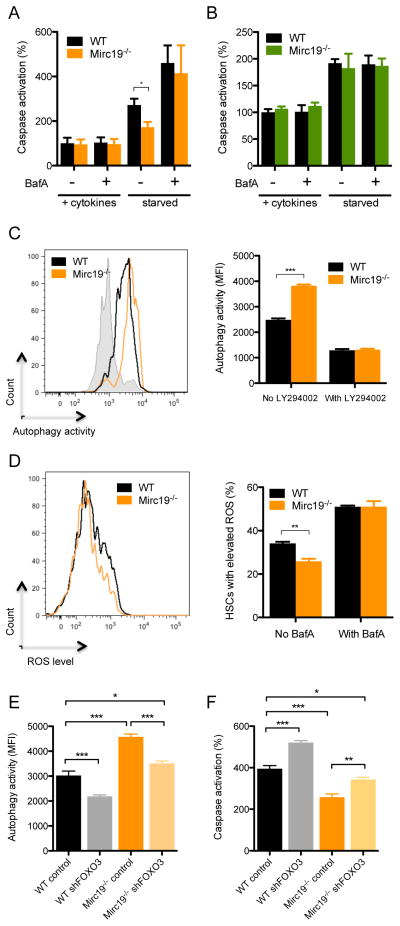
MicroRNAs are critical post-transcriptional regulators of hematopoietic cell-fate decisions, though little remains known about their role in aging hematopoietic stem cells (HSCs). We found that the microRNA-212/132 cluster (Mirc19) is enriched in HSCs and is upregulated during aging. Both overexpression and deletion of microRNAs in this cluster leads to inappropriate hematopoiesis with age. Enforced expression of miR-132 in the bone marrow of mice led to rapid HSC cycling and depletion. A genetic deletion of Mirc19 in mice resulted in HSCs that had altered cycling, function, and survival in response to growth factor starvation. We found that miR-132 exerted its effect on aging HSCs by targeting the transcription factor FOXO3, a known aging associated gene. Our data demonstrate that Mirc19 plays a role in maintaining balanced hematopoietic output by buffering FOXO3 expression. We have thus identified it as a potential target that might play a role in age-related hematopoietic defects.


Figures

Figure 1
Figure 1
miR-132 is expressed in hematopoietic stem cells (HSCs) and over-expression alters hematopoiesis. (A) miR-132 expression in mature and progenitor hematopoietic cells. Cell populations were sorted by flow cytometry directly into RNA lysis buffer and miR-132 expression was detected using TaqMan RT-qPCR (n=3). (B) – (F) WT C57BL/6 mice were lethally irradiated and reconstituted with donor bone marrow cells expressing either a control (MG) or a miR-132 over-expressing (miR-132) retroviral vector (n=8–12 mice per group). (B) Total numbers of mature leukocytes (CD45+) in the peripheral blood of MG and miR-132 mice at the indicated time points post-reconstitution. (C) Total number of HSCs (LSK CD150+ CD48) in the bone marrow of MG and miR-132 mice at 8-weeks post-reconstitution. (D) Percentage of Ki-67+ bone marrow HSCs in MG and miR-132 mice at 8-weeks post-reconstitution. (E) Protein and RNA expression of p27 in the bone marrow of MG and miR-132 mice at 8-weeks post-reconstitution (n=3). (F) Total number of LSK cells and HSCs in the bone marrow of MG and miR-132 mice at 16-weeks post-reconstitution. Data represents at least three independent experiments and is represented as mean ± SEM. See also Figure S1–S3. * denotes p < 0.05, ** denotes p < 0.01 and *** denotes p < 0.001 using a Student’s t test.
Figure 2
Figure 2
Genetic deletion of Mirc19 in mice alters hematopoietic output with age. (A) miR-132 expression in total bone marrow and LSK cells from 8-week old and 2-year old C57BL/6 WT mice. miR-132 expression was quantified by TaqMan RT-qPCR (n=2). (B) – (D) Mice with a genetic deletion of Mirc19 (Mirc19−/−) along with WT mice in the C57BL/6 background were analyzed. (B) Total number of HSCs (LSK CD150+ CD48 and LSK EPCR+) and LSK cells in the bone marrow compartment of 60–64 week old WT and Mirc19−/− mice (n=7–12 mice per group). (C) Global expression profiling of WT and Mirc19−/− HSCs, as well as short-term HSCs and MPPs, from 16-week old mice using RNA-seq. The heat map represents the number of differentially expressed genes between the different WT and Mirc19−/− populations. (D) Enriched gene-ontology terms for differently expressed genes between WT and Mirc19−/− progenitors. Data represents at least two independent experiments and is represented as mean ± SEM. See also Figure S4–S6. * denotes p < 0.05, ** denotes p < 0.01 and *** denotes p < 0.001 using a Student’s t test.
Figure 3
Figure 3
Genetic deletion of Mirc19 in mice alters hematopoietic output and cycling in response to LPS stimulation. (A) – (E) 6-month old WT and Mirc19−/− mice were treated with 9 evenly-spaced low-dose (1mg/kg of body weight) LPS or PBS injections over one month. (A) Spleen weights of WT and Mirc19−/− mice treated with PBS or LPS. (B) Proportion of HSCs and LSK cells within the bone marrow compartment of WT and Mirc19−/− mice treated with LPS or PBS. (C) Representative flow cytometry plots for cell cycle analysis of HSCs and LSK cells from WT and Mirc19−/− mice following LPS injection. (D) Proportion of bone marrow LSK cells and HSCs in each stage of the cell cycle (G0, G1, G2/M) from WT and Mirc19−/− mice following LPS injection. (E) Proportion of bone marrow LSK cells and HSCs expressing Ki67 from WT and Mirc19−/− mice following LPS injection. Data represents at least two independent experiments and is represented as mean ± SEM. See also Figure S4–S5. * denotes p < 0.05, ** denotes p < 0.01 and *** denotes p < 0.001 using a Student’s t test.
Figure 4
Figure 4
Mirc19 regulates long-term reconstitution potential of HSCs with age. (A) and (B) WT or Mirc19−/− CD45.2+ bone marrow cells, calibrated for the total number of phenotypically defined HSCs, were injected in a 1:1 ratio with CD45.1+ WT bone marrow cells into irradiated C57BL/6 CD45.2+ recipients. (A) Ratio of total CD45.2+ cells to CD45.1+ cells at 16-weeks post-reconstitution for various mature immune cell types in the peripheral blood of mice injected with aged WT and Mirc19−/− CD45.2+ cells. Data was normalized to proportion of WT CD45.2+ cells. (B) Ratio of total CD45.2+ cells to CD45.1+ cells at 16-weeks post-reconstitution for various mature immune cell types in the peripheral blood of mice injected with young WT and Mirc19−/− CD45.2+ cells. (C) Control (MG) or miR-132 over-expressing (miR-132) bone marrow HSCs, both expressing a retroviral vector containing eGFP, were injected in a 1:1 ratio with un-infected WT bone marrow HSCs into irradiated C57BL/6 mice. Graphs show the ratio of eGFP+ cells to eGFP cells for various immune cell types in the peripheral blood of recipients at 16-weeks post-reconstitution. Data represents at two independent experiments and is represented as mean ± SEM. * denotes p < 0.05 using a Student’s t test.
Figure 5
Figure 5
FOXO3 is a direct target of miR-132 in bone marrow cells. (A) mRNA expression by RT-qPCR of computationally predicted miR-132 targets in control (MG) or miR-132 over-expressing (miR-132) bone marrow cells. (B) Schematic of the predicted miR-132 binding site in the FOXO3 3′UTR. (C) Relative luciferase expression in 293T cells transfected with a miR-132 over-expression vector and either a vector containing luciferase only (control), a vector containing luciferase and the FOXO3 3′UTR immediately downstream (FOXO3 3′UTR), or a vector containing luciferase and a FOXO3 3′UTR with a mutated miR-132 binding site (FOXO3 3′UTR mut). (D) FOXO3 protein expression in bone marrow cells from MG and miR-132 mice obtained by Western Blot. (E) FOXO3 transcript expression in lineage-depleted bone marrow cells obtained from WT or miR-212/132−/− mice. (F) FOXO3 protein expression in lineage-depleted bone marrow cells obtained from WT or Mirc19−/− mice. See also Figure S7A–C. Data represents at least two independent experiments (n=2) and is represented as mean ± SEM. * denotes p < 0.05, ** denotes p < 0.01 and *** denotes p < 0.001 using a Student-T test.
Figure 6
Figure 6
Co-expression of FOXO3 with miR-132 rescues the hematopoietic defects observed with expression of miR-132 alone. (A) FOXO3 mRNA expression by RT-qPCR in total bone marrow cells from 8-week old, 1-year old and 2-year old C57BL/6 WT mice (n=2). (B) Schematic of retroviral vectors constructed for expression of FOXO3 only or for co-expression of FOXO3 along with miR-132. (C) – (F) WT C57BL/6 mice were lethally irradiated and reconstituted with donor bone marrow cells expressing either a control (MG), a miR-132 over-expressing (miR-132), a FOXO3 over-expressing (FOXO3), or a FOXO3 and miR-132 over-expressing (FOXO3 and miR-132) retroviral vector (n=10–12 mice per group). (C) Total peripheral blood CD45+ leukocytes in the respective animals at 16-weeks post-reconstitution. (D) Total LSK cells in the bone marrow compartment of the respective animals at 16-weeks post-reconstitution. (E) Total HSCs in the bone marrow compartment of the respective animals at 16-weeks post-reconstitution. (F) Proportion of bone marrow HSCs expressing Ki-67 in the respective animals at 16-weeks post-reconstitution. Data represents at least two independent experiments and is represented as mean ± SEM. See also Figure S7E–H. * denotes p < 0.05, ** denotes p < 0.01 and *** denotes p < 0.001 using a Student’s t test.
Figure 7
Figure 7
Genetic deletion of Mirc19 results in a FOXO3 dependent alteration in autophagy and survival of HSCs. (A) and (B) Cells obtained from WT and Mirc19−/− mice were cultured with or without growth cytokines (mIL3, mIL6, mSCF, TPO, Flt3L, and G-CSF) or BafA. Caspase activation was measured using a luciferase based assay (n=6). (A) Caspase activation observed in HSCs from WT and Mirc19−/− mice with or without growth factor starvation and BafA treatment. (B) Caspase activation observed in myeloid progenitors from WT and Mirc19−/− mice with or without growth factor starvation and BafA treatment. (C) Autophagy activity in WT and Mirc19−/− HSCs with or without growth factor starvation and LY294002 treatment. Autophagy was measured using a dye that fluorescently labels autophagosomes (cyto-ID autophagy assay) (n=5). (D) ROS accumulation in WT and Mirc19−/− HSCs with or without growth factor starvation and BafA treatment measured using a fluorescence-based ROS detection system (CellROX assay) (n=5). (E) and (F) WT C57BL/6 mice were lethally irradiated and reconstituted with WT or Mirc19−/− donor bone marrow cells expressing either a control or FOXO3 shRNA silencing vector. At 8-weeks post-reconstitution HSCs were sorted from bone marrow and assays were performed. (E) Autophagy activity measured in HSCs from the respective mice in response to growth factor starvation (n=6). (F) Caspase activation measured in HSCs from the respective mice in response to growth factor starvation (n=6). Data represents two independent experiments and is represented as mean ± SEM. See also Figure S7I. * denotes p < 0.05, ** denotes p < 0.01 and *** denotes p < 0.001 using a Student’s t test.

Similar articles

Cited by

References

    1. Baltimore D, Boldin MP, O’Connell RM, Rao DS, Taganov KD. MicroRNAs: new regulators of immune cell development and function. Nature immunology. 2008;9:839–845. - PubMed
    1. Chaudhuri AA, So AY, Mehta A, Minisandram A, Sinha N, Jonsson VD, Rao DS, O’Connell RM, Baltimore D. Oncomir miR-125b regulates hematopoiesis by targeting the gene Lin28A. Proceedings of the National Academy of Sciences of the United States of America. 2012;109:4233–4238. - PMC - PubMed
    1. Chen CZ, Li L, Lodish HF, Bartel DP. MicroRNAs modulate hematopoietic lineage differentiation. Science (New York, NY) 2004;303:83–86. - PubMed
    1. Ebert MS, Sharp PA. Roles for microRNAs in conferring robustness to biological processes. Cell. 2012;149:515–524. - PMC - PubMed
    1. Eijkelenboom A, Burgering BM. FOXOs: signalling integrators for homeostasis maintenance. Nature reviews Molecular cell biology. 2013;14:83–97. - PubMed

Publication types

MeSH terms

Associated data