. 2015 Sep;89(17):8733-48.
doi: 10.1128/JVI.00817-15. Epub 2015 Jun 10.

Lower Respiratory Tract Infection of the Ferret by 2009 H1N1 Pandemic Influenza A Virus Triggers Biphasic, Systemic, and Local Recruitment of Neutrophils

Affiliations

Lower Respiratory Tract Infection of the Ferret by 2009 H1N1 Pandemic Influenza A Virus Triggers Biphasic, Systemic, and Local Recruitment of Neutrophils

Jeremy V Camp et al. J Virol. 2015 Sep.

Abstract

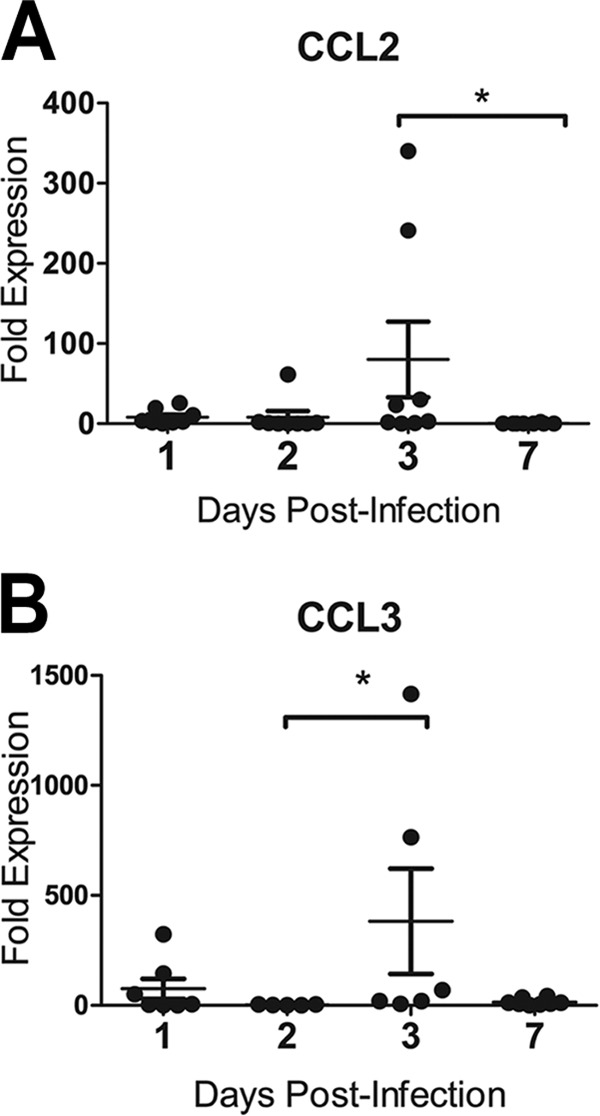
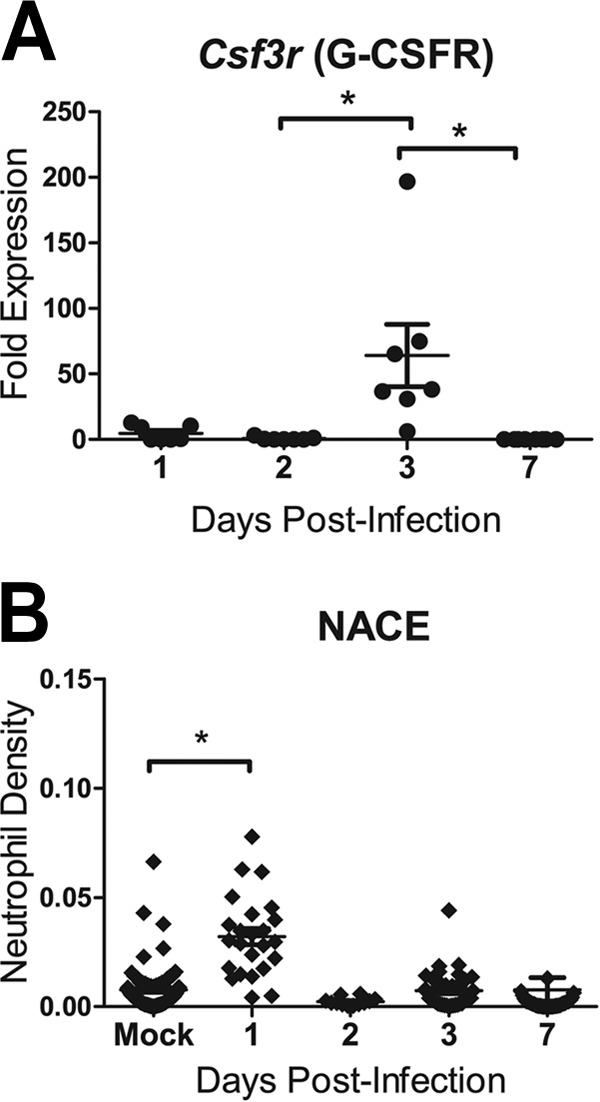
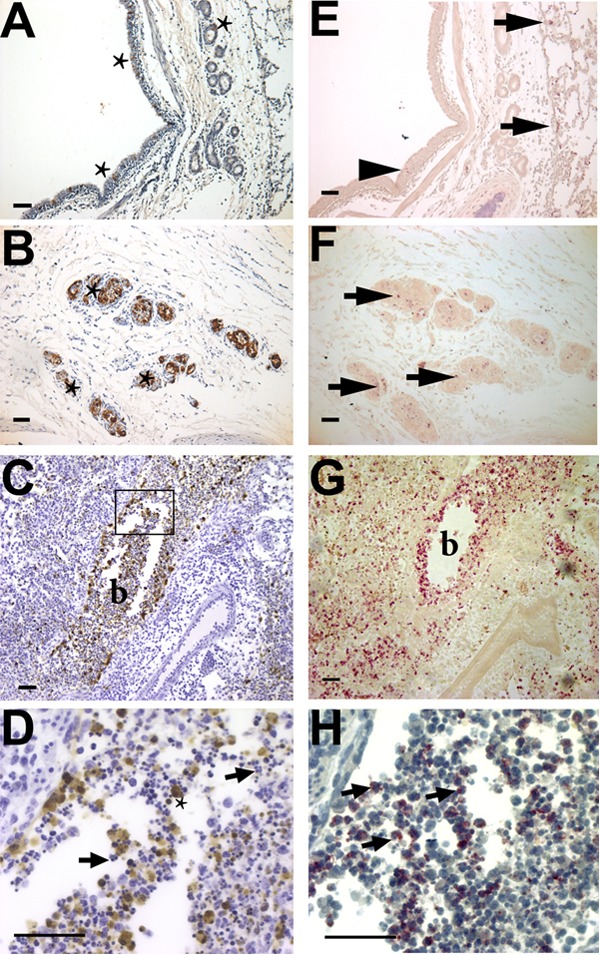
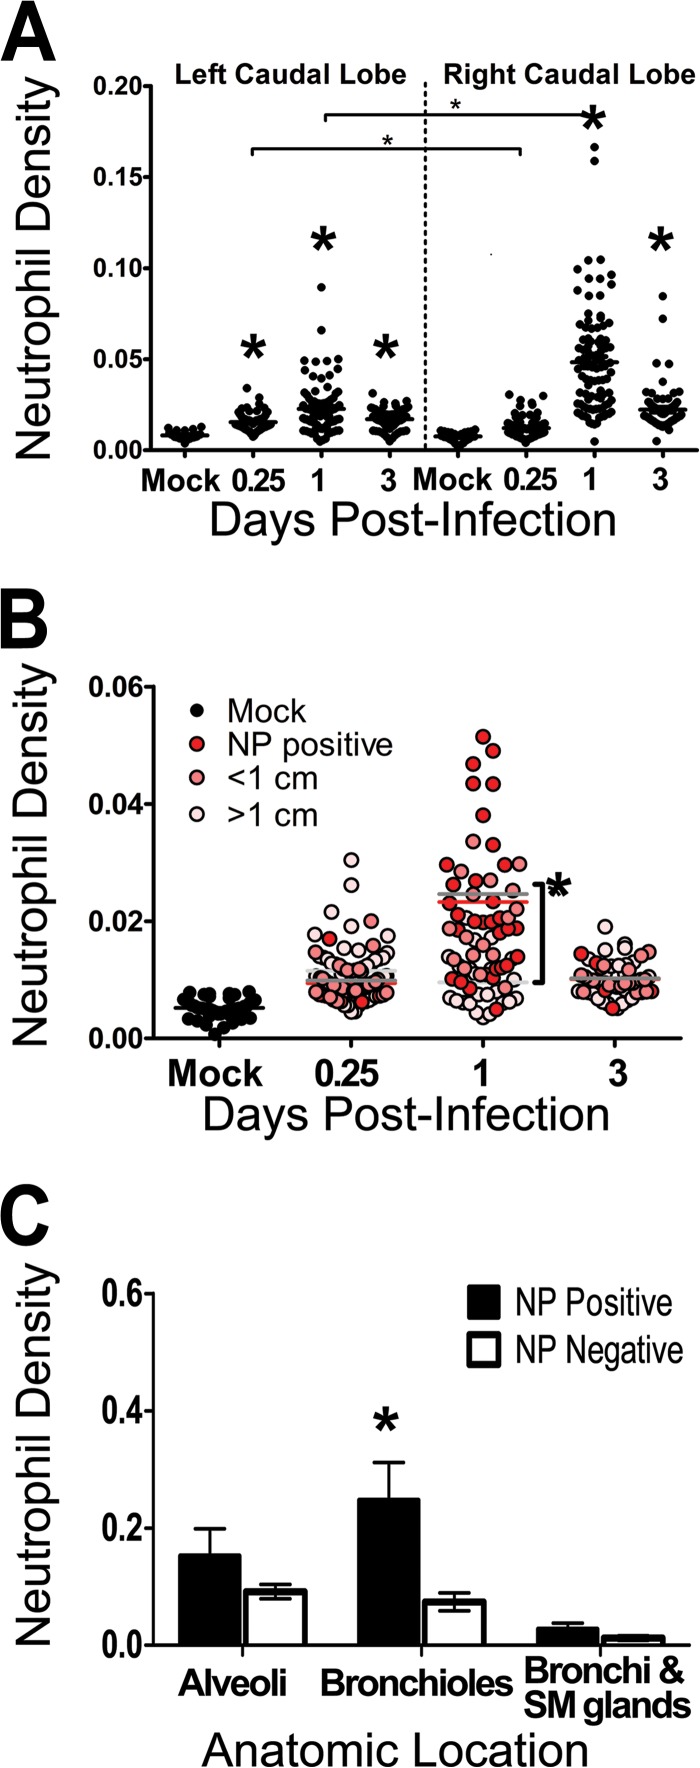
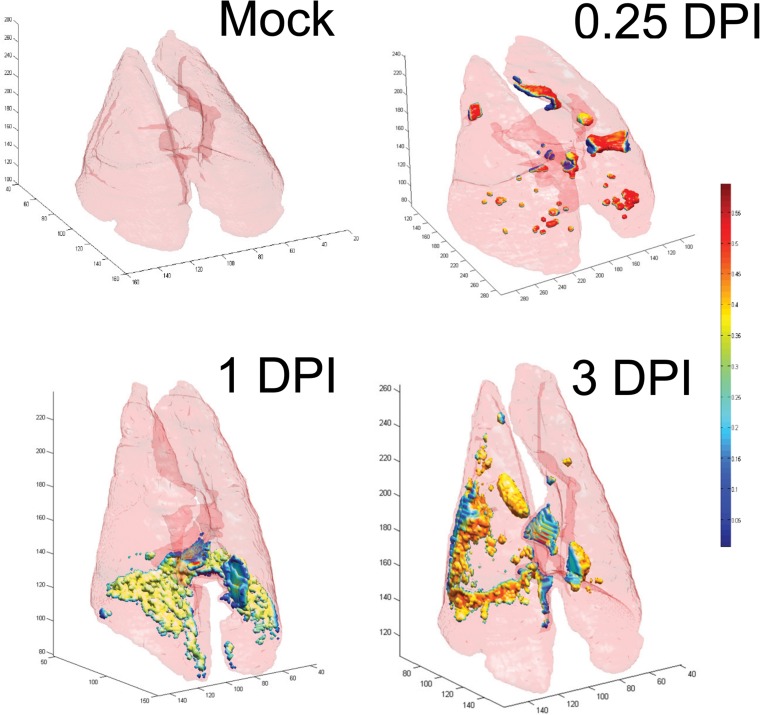
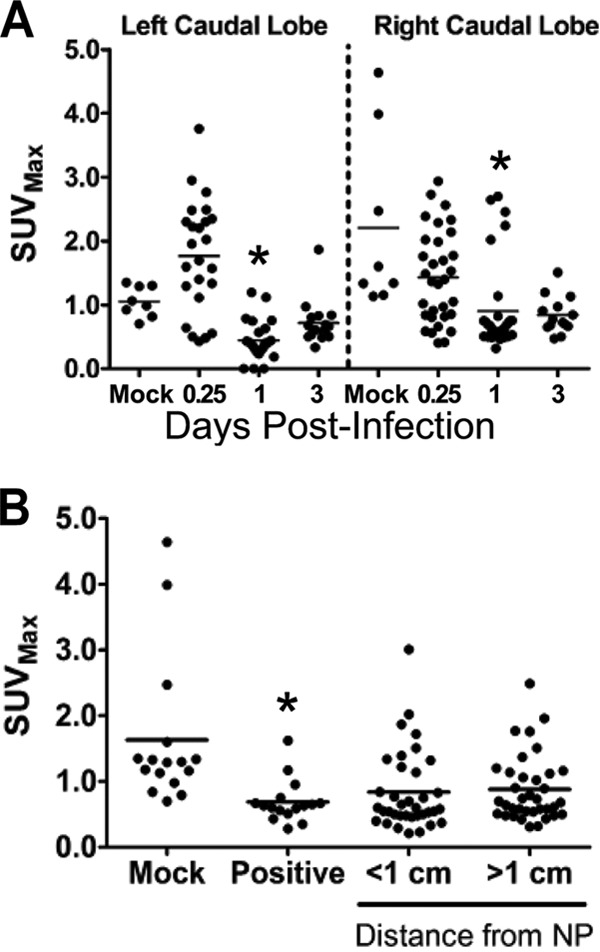
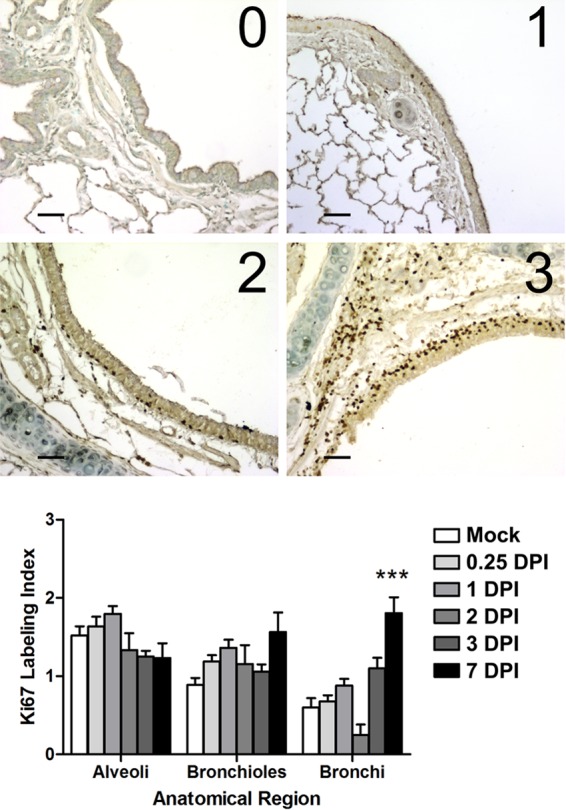
Infection of the lower respiratory tract by influenza A viruses results in increases in inflammation and immune cell infiltration in the lung. The dynamic relationships among the lung microenvironments, the lung, and systemic host responses during infection remain poorly understood. Here we used extensive systematic histological analysis coupled with live imaging to gain access to these relationships in ferrets infected with the 2009 H1N1 pandemic influenza A virus (H1N1pdm virus). Neutrophil levels rose in the lungs of H1N1pdm virus-infected ferrets 6 h postinfection and became concentrated at areas of the H1N1pdm virus-infected bronchiolar epithelium by 1 day postinfection (dpi). In addition, neutrophil levels were increased throughout the alveolar spaces during the first 3 dpi and returned to baseline by 6 dpi. Histochemical staining revealed that neutrophil infiltration in the lungs occurred in two waves, at 1 and 3 dpi, and gene expression within microenvironments suggested two types of neutrophils. Specifically, CCL3 levels, but not CXCL8/interleukin 8 (IL-8) levels, were higher within discrete lung microenvironments and coincided with increased infiltration of neutrophils into the lung. We used live imaging of ferrets to monitor host responses within the lung over time with [(18)F]fluorodeoxyglucose (FDG). Sites in the H1N1pdm virus-infected ferret lung with high FDG uptake had high levels of proliferative epithelium. In summary, neutrophils invaded the H1N1pdm virus-infected ferret lung globally and focally at sites of infection. Increased neutrophil levels in microenvironments did not correlate with increased FDG uptake; hence, FDG uptake may reflect prior infection and inflammation of lungs that have experienced damage, as evidenced by bronchial regeneration of tissues in the lungs at sites with high FDG levels.

Importance: Severe influenza disease is characterized by an acute infection of the lower airways that may progress rapidly to organ failure and death. Well-developed animal models that mimic human disease are essential to understanding the complex relationships of the microenvironment, organ, and system in controlling virus replication, inflammation, and disease progression. Employing the ferret model of H1N1pdm virus infection, we used live imaging and comprehensive histological analyses to address specific hypotheses regarding spatial and temporal relationships that occur during the progression of infection and inflammation. We show the general invasion of neutrophils at the organ level (lung) but also a distinct pattern of localized accumulation within the microenvironment at the site of infection. Moreover, we show that these responses were biphasic within the lung. Finally, live imaging revealed an early and sustained host metabolic response at sites of infection that may reflect damage and repair of tissues in the lungs.


Figures

FIG 1
FIG 1
Sampling scheme for experiments on the temporal and spatial distribution of inflammation and infection in ferrets after H1N1pdm virus challenge. Comprehensive histological sampling of ferret lungs was performed at time points following intranasal infection with 106 TCID50s of H1N1pdm virus (A/Kentucky/180/10)/ferret. Samples were taken at 0.25, 1, and 3 dpi from 2 infected ferrets per time point, and from 2 mock-infected ferrets at 3 dpi, immediately following PET-CT imaging. (Left) Diagram of a ferret lung showing the method by which the left caudal lobe was divided (dashed lines on expanded lobe) for histology. The right caudal lobe was similarly divided into at least 4 cross sections along the main branching bronchus (cuts not shown). Ferret lung lobes are labeled as follows: RCr, right cranial lobe; LCr, left cranial lobe; RCa, right caudal lobe; LCa, left caudal lobe; RM, right middle lobe; Acc, accessory lobe. (Center) The resulting cross sections of tissues are shown as black-and-white photos of histological slides, numbered according to the locations on the lung diagram. (Right) Outlines of the tissues were given to a blinded observer for the selection of four regions for IHC analysis (boxed areas). This sampling scheme for IHC was used to analyze the pattern of neutrophil infiltration, as well as computed tomography and positron emission tomography images.
FIG 2
FIG 2
Inflammatory cytokine and chemokine gene expression in the ferret lung after infection with influenza A virus (H1N1pdm). Female ferrets (2 per time point) were infected with 106 TCID50s each of H1N1pdm virus (A/Kentucky/180/2010). The right caudal lung lobe from each H1N1pdm virus-infected and mock-infected (1 ferret per time point) ferret was taken upon euthanasia on days 1, 2, 3, and 7 postinfection and was divided into four sections. Each section was homogenized separately, and cDNA was synthesized for gene expression analysis. Ferret gene-specific primers were developed to cross exons, and RT-PCR was performed to identify the expression of the genes encoding leukocyte chemoattractant chemokines CCL2 (A) and CCL3 (B). Fold expression is compared to the expression of housekeeping controls (GAPDH) and to expression in mock-infected animals by using the ΔΔCT method. Asterisks indicate significant differences between days by nonparametric statistical tests, corrected for multiple comparisons.
FIG 3
FIG 3
Neutrophils were detected in ferret lung sections after infection with influenza A virus (H1N1pdm). Female ferrets (2 per time point) were infected with 106 TCID50s each of the H1N1pdm virus (A/Kentucky/180/2010). (A) The right caudal lung lobe from H1N1pdm virus-infected and mock-infected (1 ferret per time point) ferrets was taken upon euthanasia on days 1, 2, 3, and 7 postinfection and was divided into four sections. Each section was homogenized separately, and cDNA was synthesized for gene expression analysis. Ferret gene-specific primers were developed to cross exons, and RT-PCR was performed to identify the expression of a neutrophil-expressed gene (Csf3r, encoding G-CSFR) relative to the expression of housekeeping controls and to expression in mock-infected animals. Asterisks indicate significant differences between days by nonparametric statistical tests, corrected for multiple comparisons. (B) Other lung lobes (left cranial, right cranial, left caudal, and middle) taken from each ferret were prepared for IHC, and one slice from each was stained for neutrophils (NACE). Neutrophils were quantified in images (taken with a 20× objective) from 3 regions on each of the NACE-stained slides by using ImageJ image analysis software. The number of NACE-positive pixels divided by the number of total tissue-containing pixels is presented as the neutrophil density. The asterisk indicates a significant difference in distribution from that in mock-infected ferrets by nonparametric statistical tests.
FIG 4
FIG 4
Immunohistochemical staining of influenza virus nucleoprotein and neutrophils in ferret lungs. Shown are histological preparations from the right caudal lobe of a female ferret 1 day after infection with 106 TCID50s of an H1N1pdm virus isolate (A/KY/180/2010). (A to D) The influenza antigen (NP) is stained brown, with a hematoxylin (blue) counterstain. (E to H) Neutrophils are stained pink with NACE in a serial section of the same region of the lung as the IHC NP stain (without a counterstain in panels E to G to show the bright pink NACE stain; with the blue hematoxylin counterstain in panel H). (A) Influenza virus-infected cells (stars) in the pseudostratified columnar epithelium of the bronchus of a ferret 2 days postinfection. (B) Infected seromucinous glands (three are marked with stars, but more are visible). (C) Infection of the bronchiolar epithelium (lumen marked “b”) was more common than infection of other sites, and the antigen can be seen within luminal cells. (D) Magnification of the region boxed in panel C. Many NP-positive cells (star) are macrophages, and the lumen of the bronchiole is filled with polymorphonuclear neutrophils (arrows indicate two, but many more are visible). (E) Few neutrophils are present at sites of influenza virus-infected epithelial cells within the epithelial layer of the bronchus (arrowhead), but more are present within the alveolar spaces adjacent to these sites (arrows). (F) Inflammatory cells within the infected submucosal glands are neutrophils (arrows indicate three areas, but more are present in each gland). (G) Extensive neutrophil infiltration in the bronchiolar lumen (b). (H) Magnification of a serial section of panel G that is stained for NACE and counterstained with hematoxylin to show the morphological features defining neutrophils (arrows show three, but many more are visible). Images were taken with a 10× (A to C and E to G) or 40× (D and H) objective. Bars, 50 μm.
FIG 5
FIG 5
Neutrophils in the lungs of ferrets after infection with influenza A virus (H1N1pdm). Ferrets were infected with 106 TCID50s of an H1N1pdm virus isolate (A/KY/180/2010), and lung tissues were taken upon euthanasia and were processed for histology. Caudal lung lobes, taken from two infected ferrets per day (0.25, 1, and 3 dpi), were systematically divided and were prepared for histology. Neutrophils in sections histochemically stained with NACE were quantified by using image analysis software, and data are expressed as the neutrophil density (the number of neutrophil-positive pixels per total tissue pixels on each image). (A) Neutrophil density was quantified over time. Data are divided by lobe. Large asterisks indicate significant differences from mock-infected animals, and significant differences between lobes are indicated by bars with small asterisks above them (P < 0.05 by nonparametric statistical tests). (B) Influenza virus nucleoprotein (NP) was identified on histological sections by IHC. The neutrophil density was calculated from serial NACE-stained sections; data were grouped according to distance from known NP-positive cells; and sites of IAV-positive cells were matched to distant sites within the same ferret (red, pink, and light-pink dots indicate NP-positive sites and sites <1 cm and >1 cm from NP-positive sites, respectively) and to sites in mock-infected animals (black dots). Data are plotted over time, and means at a given time point are indicated by lines colored according to distance (red, medium-gray, and light-gray lines for NP-positive sites and sites <1 cm and >1 cm from NP-positive sites, respectively). The asterisk indicates a significant difference between sites at a given time point. (C) Neutrophil density was calculated from pictures taken at sites of known influenza virus infection (NP positive), and data were grouped by anatomic region (alveoli, bronchioles, and bronchi with submucosal [SM] glands). These images were site-matched within the same ferret (<1 cm from known IAV-positive sites) to anatomic regions that had no IAV-positive cells (NP negative). Note that NP-positive cells at alveolar sites were leukocytes and that data for mock-infected animals are not shown on this panel but are shown in panels A and B. Asterisks indicate significant differences between NP-positive and NP-negative sites.
FIG 6
FIG 6
Rendering of PET-CT images of ferret lungs at different time points after infection with the H1N1pdm virus. Stacked whole-lung images give 3-dimensional views at three time points following infection with 106 TCID50s of the H1N1pdm virus (A/KY/180/2010). Lungs from only one ferret per time point (including a mock-infected ferret at 3 dpi) are shown. Ferrets were injected with an intraperitoneal dose of radiolabeled FDG, and lungs were imaged using PET-CT 1 h later. For each image, the light pink surface corresponds to the border of the lung that was segmented from CT images by an automated CT analysis. PET-CT fusion images were used to define the uptake of FDG within the segmented lung space, and the intensity of FDG uptake is represented by small colored volumes within the lung borders. Regions of FDG uptake are colored according to voxel intensity within the FDG-PET image, as shown on the color scale on the right (from <0.05 [blue] to >0.5 [dark red]).
FIG 7
FIG 7
Distribution of cellular uptake of radiolabeled FDG during influenza virus infection in ferrets. Female ferrets were infected with 106 TCID50s of the H1N1pdm virus (A/KY/180/2010). A radiolabeled glucose analog (FDG) was injected at 0.25, 1, and 3 days postinfection, and ferrets (2 per time point) were imaged 1 h later. Ferrets were euthanized immediately after imaging, and lung tissues were prepared for histology. (A) The temporal distribution of FDG uptake (maximum standard uptake value [SUVmax] within a defined volume) was measured in images taken by positron emission tomography after locating histology slices by using anatomical references in registered computed tomography images. These areas matched areas analyzed for neutrophil infiltration and approximate a 3D grid of each ferret caudal lung lobe. (B) Spatial distribution of FDG uptake at sites in the ferret lung grouped by distance from IAV nucleoprotein (NP)-positive cells within the lungs. The presence of the H1N1pdm virus was measured by immunohistochemical staining for viral nucleoprotein. Asterisks indicate statistically significant differences from mock-infected animals.
FIG 8
FIG 8
Proliferation of lung epithelial cells measured by the Ki-67 labeling index. (Top) Images representative of the scoring system (labeling index scores 0 to 3) used to grade the extent of lung cellular proliferation (Ki-67 antigen positivity) in immunohistochemical sections taken from ferrets infected with 106 TCID50s of the H1N1pdm virus (A/KY/180/2010). Bar, 50 μm. (Bottom) The left and right cranial, left caudal, and middle lobes were taken at necropsy (at 0.25, 1, 2, 3, and 7 dpi) and were prepared for histology. Bronchi, bronchioles, and alveolar spaces were analyzed in the lobes of each ferret per time point (18 to 50 images [not shown] per anatomic region per time point). The images were scored by two independent observers for the levels of Ki-67 positive cells. Shown is the mean proliferation index per anatomic region over time (error bars represent the standard errors of the means). Asterisks indicate a significant difference (***, P < 0.01) from the score for mock-infected animals by a nonparametric statistical test.

Similar articles

Cited by

References

    1. Preaud E, Durand L, Macabeo B, Farkas N, Sloesen B, Palache A, Shupo F, Samson SI, Vaccines Europe influenza working group. 2014. Annual public health and economic benefits of seasonal influenza vaccination: a European estimate. BMC Public Health 14:813. doi:10.1186/1471-2458-14-813. - DOI - PMC - PubMed
    1. Lu PJ, Santibanez TA, Williams WW, Zhang J, Ding H, Bryan L, O'Halloran A, Greby SM, Bridges CB, Graitcer SB, Kennedy ED, Lindley MC, Ahluwalia IB, LaVail K, Pabst LJ, Harris L, Vogt T, Town M, Singleton JA, Centers for Disease Control and Prevention. 2013. Surveillance of influenza vaccination coverage—United States, 2007–08 through 2011–12 influenza seasons. MMWR Surveill Summ 62(SS-04):1–28. - PubMed
    1. Nichol KL, Treanor JJ. 2006. Vaccines for seasonal and pandemic influenza. J Infect Dis 194(Suppl 2):S111–S118. doi:10.1086/507544. - DOI - PubMed
    1. Pearce MB, Belser JA, Houser KV, Katz JM, Tumpey TM. 2011. Efficacy of seasonal live attenuated influenza vaccine against virus replication and transmission of a pandemic 2009 H1N1 virus in ferrets. Vaccine 29:2887–2894. doi:10.1016/j.vaccine.2011.02.014. - DOI - PubMed
    1. Hancock K, Veguilla V, Lu X, Zhong W, Butler EN, Sun H, Liu F, Dong L, DeVos JR, Gargiullo PM, Brammer TL, Cox NJ, Tumpey TM, Katz JM. 2009. Cross-reactive antibody responses to the 2009 pandemic H1N1 influenza virus. N Engl J Med 361:1945–1952. doi:10.1056/NEJMoa0906453. - DOI - PubMed

Publication types

MeSH terms

LinkOut - more resources