. 2015 Jun 4;161(6):1400-12.
doi: 10.1016/j.cell.2015.05.008.

Widespread Co-translational RNA Decay Reveals Ribosome Dynamics

Affiliations

Widespread Co-translational RNA Decay Reveals Ribosome Dynamics

Vicent Pelechano et al. Cell. .

Abstract

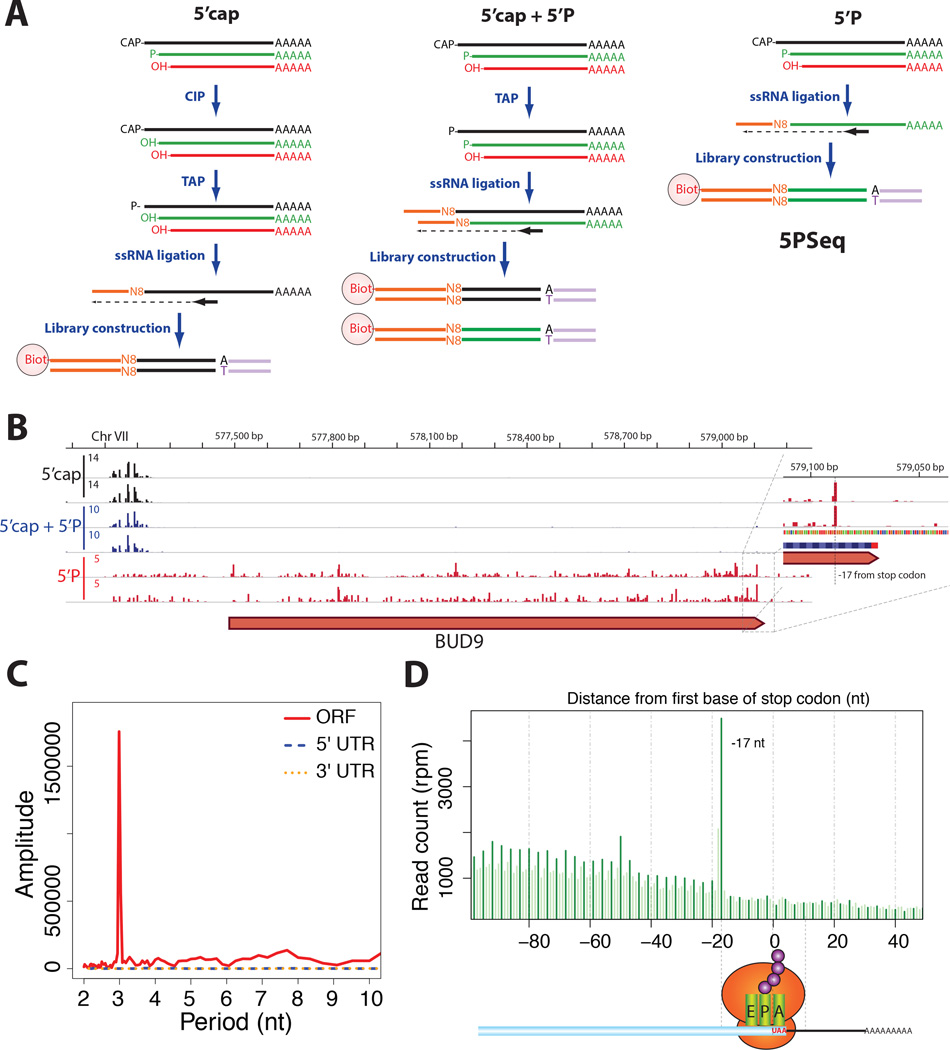
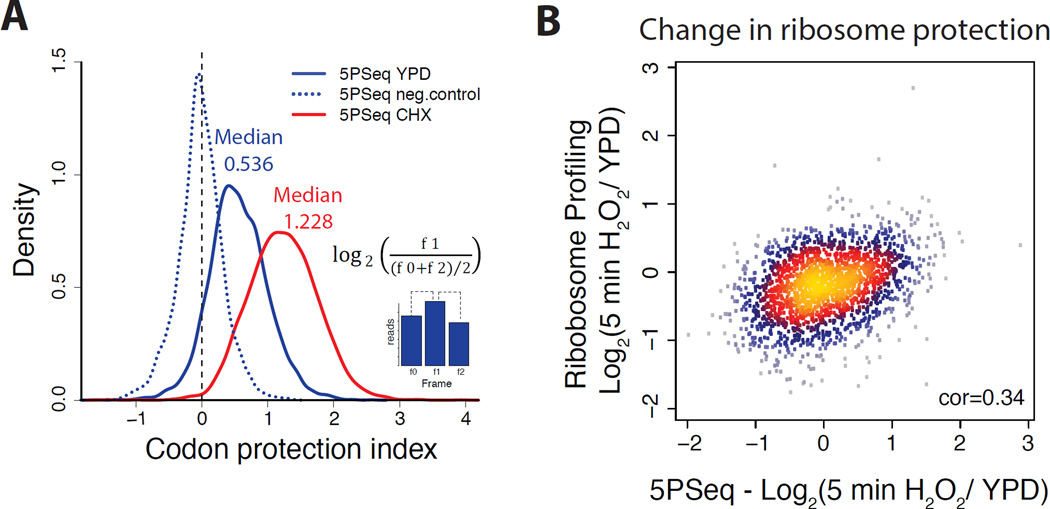
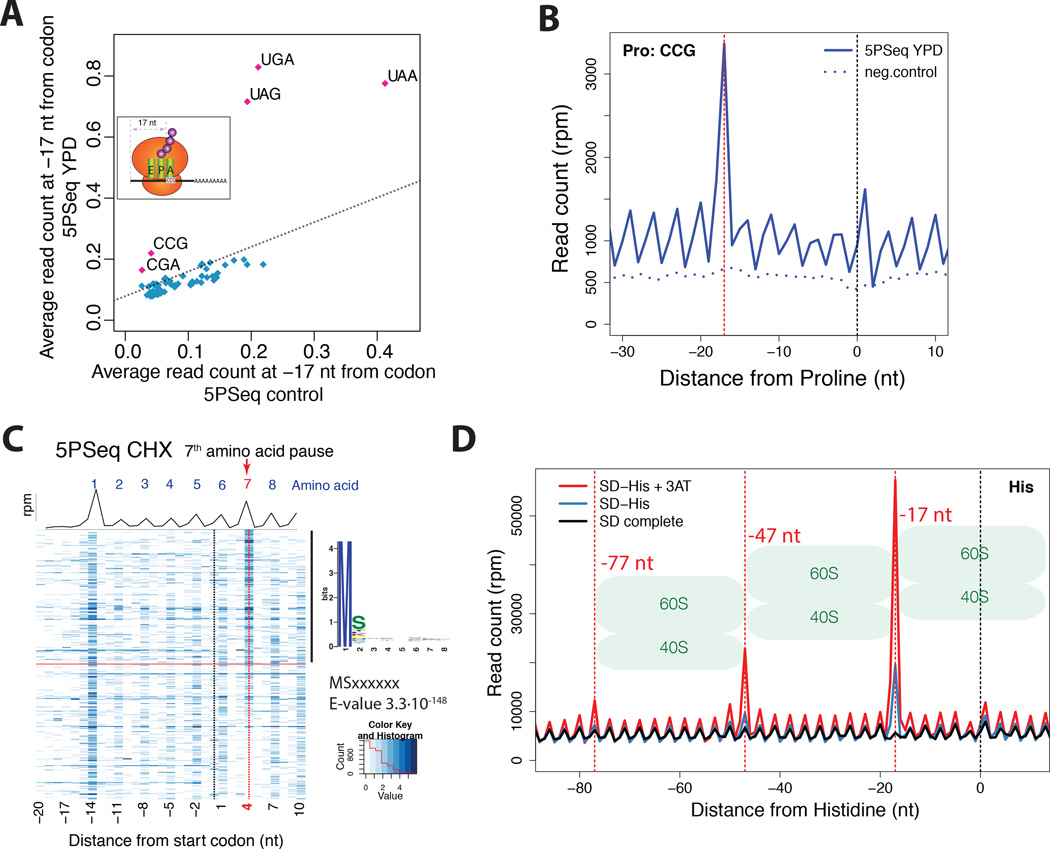
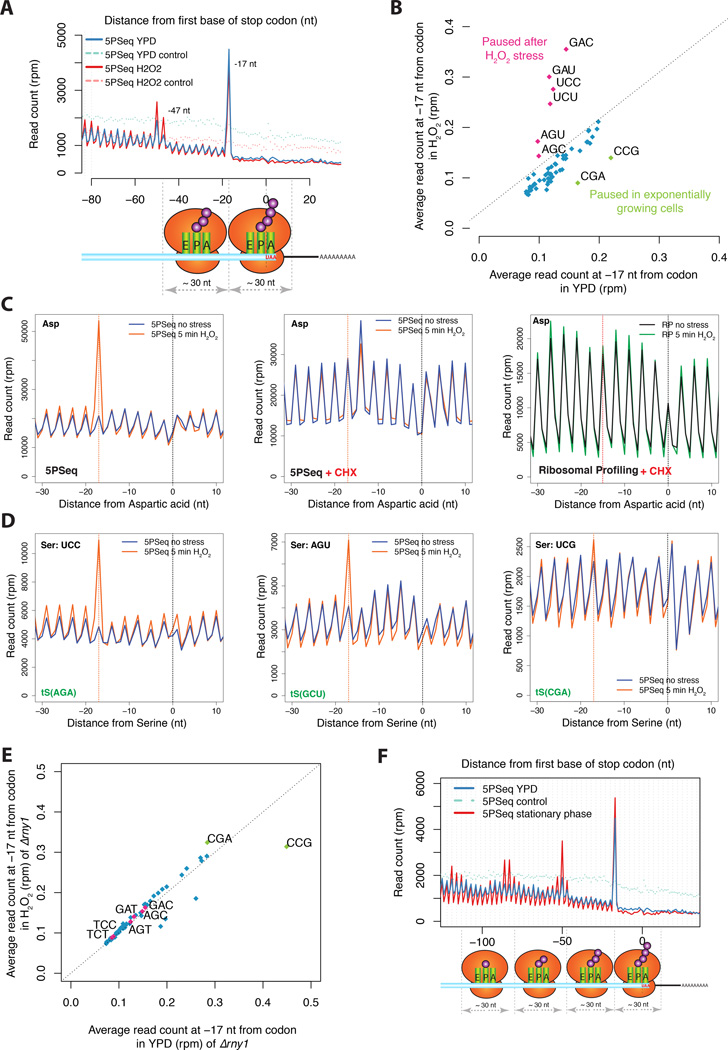
It is generally assumed that mRNAs undergoing translation are protected from decay. Here, we show that mRNAs are, in fact, co-translationally degraded. This is a widespread and conserved process affecting most genes, where 5'-3' transcript degradation follows the last translating ribosome, producing an in vivo ribosomal footprint. By sequencing the ends of 5' phosphorylated mRNA degradation intermediates, we obtain a genome-wide drug-free measurement of ribosome dynamics. We identify general translation termination pauses in both normal and stress conditions. In addition, we describe novel codon-specific ribosomal pausing sites in response to oxidative stress that are dependent on the RNase Rny1. Our approach is simple and straightforward and does not require the use of translational inhibitors or in vitro RNA footprinting that can alter ribosome protection patterns.


Conflict of interest statement

The authors declare no conflict of interest.

Figures

Figure 1
Figure 1. Genome-wide distribution of 5’P degradation intermediates
A) Schematic diagram of 5’ specific sequencing methods that capture capped molecules, 5’P or the composite of both populations. In the case of 5PSeq, only 5’P RNA (in green) is able to ligate to a DNA/RNA oligo containing a molecular barcode (in orange). B) Genome tracks of 5’ ends of capped (black), 5’P (red) or a composite of both capped and 5’P RNA molecules (blue). Coverage is expressed in reads per million (rpm), biological replicates are shown. C) Discrete Fourier transformation of average 5PSeq reads across the ORF, 5’UTR or 3’ UTR. D) Histogram of 5PSeq reads at each nucleotide position surrounding the stop codon. Protected frame is highlighted in dark green.
Figure 2
Figure 2. Ribosome protection shapes the abundance of 5’P degradation intermediates
A) Metagene analysis displaying the abundance of 5’P reads relative to ORF stop codons for cells in rich media (5PSeq YPD, in blue), in a mutant for the 5’-3’ RNA exonuclease (xrn1Δ, in pink), or after random fragmentation (5PSeq control, dotted light blue line). The blue peak at −17 nt corresponds to the protection of a putative termination-paused ribosome. Reads are represented in rpm (reads per million) and biological replicates are merged. B) Three nucleotide periodicity pattern, displayed by histograms with the total number of reads overlapping each of the three frames along coding regions for 5PSeq in YPD (blue), random fragmentation (light blue), xrn1Δ strain (pink), and after cycloheximide treatment for isolated monosomes (yellow), polyribosome fractions (green) or total RNA (in purple). C) Genome tracks of 5’ ends of 5’P molecules after cycloheximide treatment (in red), standard growth in YPD for a wild-type strain (in blue) and for xrn1Δ (in purple). For comparison a track displaying 5’ cap molecules (in grey) and random fragmented 5’ ends (in black) are shown. Coverage is expressed in reads per million (rpm). Horizontal bars represent regions significantly (FDR<0.1) enriched (in red) for 5PSeq coverage, when comparing CHX treatment with standard YPD conditions. D) Metagene analysis displaying the abundance of 5’P reads relative to ORF start and stop codons as in panel A. 5’P reads after cycloheximide treatment is shown in purple (5PSeq CHX). E) Proportion of 5PSeq reads in the ribosome-protected frame (Frame 1 in panel B), shown as smoothed lines (smooth splines) for genes without introns and longer than 600bp. 5PSeq samples from cells grown YPD (blue), after 5 min oxidative stress (brown), 3-AT treatment (orange), cycloheximide treatment (purple) or random fragmentation (light blue dashed line) are shown. The dotted black line shows the random expected frequency of 0.33. F) Model for differential mRNA footprinting in 5PSeq compared to ribosome profiling.
Figure 3
Figure 3. The abundance of co-translational mRNA degradation intermediates reflects translational regulation
A) Histogram for codon protection index as a measure for co-translational degradation. Codon protection index was computed as the log2 ratio of the reads corresponding to the protected frame (f1) in respect to the average number of reads of the non-protected frames ((f0+f2)/2). This ratio was computed for cells in rich media (blue), after CHX treated (red) and randomly fragmented samples (dotted blue line). Only genes with at least 50 reads were considered for the analysis. B) Scatter plot comparing the variation of abundance of 5PSeq reads in the body of the gene (xaxis) with the variation of ribosome profiling reads (y-axis) (Gerashchenko et al., 2012) after 5 minutes treatment with H2O2 0.2mM. Spearman correlation coefficient is shown.
Figure 4
Figure 4. 5PSeq allows exploration of ribosome dynamics at codon resolution
A) 5PSeq coverage 17 nt upstream of each codon (y-axis) compared with the random fragmented sample (x-axis). Stop codons (UGA, UAG and UAA), CGA (Arginine) and CCG (Proline) present an increased pausing. The dashed line was estimated by comparing the average percentage of reads at frame 1 in all codons between 5PSeq and random fragmented control. B) Metagene displaying the abundance of 5’P reads in respect to the rare proline codon (CCG) for cells in rich media (blue) and a randomly fragmented samples (dotted blue line). The expected 5’ endpoint protection (−17 nt) is displayed by a dotted red line C) Metagene representing both the average coverage (black line) and gene-specific coverage (blue heatmap) for cells grown after cycloheximide treatment. Only genes with at least 10 reads in the displayed regions were considered. Genes were sorted by the ratio of reads at position 4 nt (red dotted line) to the reads corresponding to the surrounding +/−2 codons. To identify specific peptide sequences, the first 8 amino acids of the top 50% of genes were compared to the bottom half using MEME (Bailey et al., 2009). D) Metagene displaying the abundance of 5’P reads with respect to histidine codons for 5PSeq of cells in synthetic defined media (SD, in black), SD media without Histidine (in blue) and SD media without histidine poisoned with 3-AT (in red). At −17, −47 and −77 nt, dotted red lines corresponding to the expected 5' endpoints of protection by a ribosome, disome or trisomes halted at the histidine codon are displayed.
Figure 5
Figure 5. Drug free approach allows the exploration of new ribosome dynamics
A) Metagene displaying the abundance of 5’P reads with respect to stop codons for 5PSeq of cells in rich media (in blue) or after 5 minutes H2O2 0.2mM treatment (in pink). Randomly fragmened controls are shown in dashed lines. B) 5PSeq coverage 17 nt upstream of each codon after H2O2 treatment (y-axis) compared to exponentially growing cells (x-axis) as in Figure 4A. Codons paused after stress are highlighted in pink and codons paused in exponential growth are highlighted in green. Only amino acid coding codons are shown. C) Metagene displaying the Asp specific ribosome pausing after 5 minutes H2O2 0.2mM stress. The clear protection pattern is lost both by the treatment with cycloheximide or if analysed by ribosome profiling (Gerashchenko et al., 2012). The expected 5’ endpoint protection (−17 nt, or −15 for ribosome profiling) is displayed by a dotted red line D) Upon oxidative stress (orange line) a clear pause can be observed at the codons UCC and AGU, but not at UCG. As shown in panel C. E) Relative codon pausing after oxidative stress in an rny1Δ strain as shown in Figure 5B. F) Metagene displaying the abundance of 5’P reads with respect to stop codons in cells grown in rich media (in blue and 5PSeq control in light blue dashed line) or in a saturated culture (5PSeq stationary phase in red).
Figure 6
Figure 6. Co-translational degradation is an evolutionarily conserved process
A) Metagene displaying the abundance of 5’P reads with respect to stop codons for 5PSeq of cells in rich media (in blue), after 5 or 30 minutes treatment with cycloheximide (in pink and magenta respectively) or a randomly fragmented sample (dotted light blue line) for S. pombe. Shown as in Figure 2. B) Histograms showing the total number of reads in each reading frame within coding regions for 5PSeq YES (in blue), 5PSeq after cycloheximide treatment (in pink and magenta), and randomly fragmented sample (in light blue) for S. pombe.

Comment in

Similar articles

Cited by

References

    1. Addo-Quaye C, Eshoo TW, Bartel DP, Axtell MJ. Endogenous siRNA and miRNA targets identified by sequencing of the Arabidopsis degradome. Current biology : CB. 2008;18:758–762. - PMC - PubMed
    1. Anderson JS, Parker RP. The 3' to 5' degradation of yeast mRNAs is a general mechanism for mRNA turnover that requires the SKI2 DEVH box protein and 3' to 5' exonucleases of the exosome complex. The EMBO journal. 1998;17:1497–1506. - PMC - PubMed
    1. Arava Y, Boas FE, Brown PO, Herschlag D. Dissecting eukaryotic translation and its control by ribosome density mapping. Nucleic acids research. 2005;33:2421–2432. - PMC - PubMed
    1. Arava Y, Wang Y, Storey JD, Liu CL, Brown PO, Herschlag D. Genome-wide analysis of mRNA translation profiles in Saccharomyces cerevisiae. Proceedings of the National Academy of Sciences of the United States of America. 2003;100:3889–3894. - PMC - PubMed
    1. Bailey TL, Boden M, Buske FA, Frith M, Grant CE, Clementi L, Ren J, Li WW, Noble WS. MEME SUITE: tools for motif discovery and searching. Nucleic acids research. 2009;37:W202–W208. - PMC - PubMed

Publication types

MeSH terms

Associated data