Muscle stem cells contribute to myofibres in sedentary adult mice
- PMID: 25971691
- PMCID: PMC4435732
- DOI: 10.1038/ncomms8087
Muscle stem cells contribute to myofibres in sedentary adult mice
Abstract
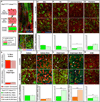
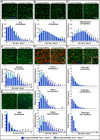
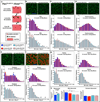
Skeletal muscle is essential for mobility, stability and whole body metabolism, and muscle loss, for instance, during sarcopenia, has profound consequences. Satellite cells (muscle stem cells) have been hypothesized, but not yet demonstrated, to contribute to muscle homeostasis and a decline in their contribution to myofibre homeostasis to play a part in sarcopenia. To test their role in muscle maintenance, we genetically labelled and ablated satellite cells in adult sedentary mice. We demonstrate via genetic lineage experiments that, even in the absence of injury, satellite cells contribute to myofibres in all adult muscles, although the extent and timing differs. However, genetic ablation experiments showed that satellite cells are not globally required to maintain myofibre cross-sectional area of uninjured adult muscle.
Figures


Similar articles
-
Pax7-expressing satellite cells are indispensable for adult skeletal muscle regeneration.Development. 2011 Sep;138(17):3647-56. doi: 10.1242/dev.067587. Development. 2011. PMID: 21828093
-
Self-renewal and expansion of single transplanted muscle stem cells.Nature. 2008 Nov 27;456(7221):502-6. doi: 10.1038/nature07384. Epub 2008 Sep 17. Nature. 2008. PMID: 18806774 Free PMC article.
-
Moderate-intensity treadmill running promotes expansion of the satellite cell pool in young and old mice.FEBS J. 2013 Sep;280(17):4063-73. doi: 10.1111/febs.12228. Epub 2013 Apr 12. FEBS J. 2013. PMID: 23464362 Free PMC article.
-
All muscle satellite cells are equal, but are some more equal than others?J Cell Sci. 2008 Sep 15;121(Pt 18):2975-82. doi: 10.1242/jcs.019661. J Cell Sci. 2008. PMID: 18768931 Review.
-
Skeletal muscle degeneration and regeneration in mice and flies.Curr Top Dev Biol. 2014;108:247-81. doi: 10.1016/B978-0-12-391498-9.00007-3. Curr Top Dev Biol. 2014. PMID: 24512712 Review.
Cited by
-
PTPN1/2 inhibition promotes muscle stem cell differentiation in Duchenne muscular dystrophy.Life Sci Alliance. 2024 Oct 30;8(1):e202402831. doi: 10.26508/lsa.202402831. Print 2025 Jan. Life Sci Alliance. 2024. PMID: 39477543 Free PMC article.
-
Uterine Insulin Sensitivity Defects Induced Embryo Implantation Loss Associated with Mitochondrial Dysfunction-Triggered Oxidative Stress.Oxid Med Cell Longev. 2021 Apr 12;2021:6655685. doi: 10.1155/2021/6655685. eCollection 2021. Oxid Med Cell Longev. 2021. PMID: 33953835 Free PMC article.
-
The chemokine receptor CXCR4 regulates satellite cell activation, early expansion, and self-renewal, in response to skeletal muscle injury.Front Cell Dev Biol. 2022 Sep 22;10:949532. doi: 10.3389/fcell.2022.949532. eCollection 2022. Front Cell Dev Biol. 2022. PMID: 36211464 Free PMC article.
-
Myogenin is an essential regulator of adult myofibre growth and muscle stem cell homeostasis.Elife. 2020 Oct 1;9:e60445. doi: 10.7554/eLife.60445. Elife. 2020. PMID: 33001028 Free PMC article.
-
Genetic Evidence That Captured Retroviral Envelope syncytins Contribute to Myoblast Fusion and Muscle Sexual Dimorphism in Mice.PLoS Genet. 2016 Sep 2;12(9):e1006289. doi: 10.1371/journal.pgen.1006289. eCollection 2016 Sep. PLoS Genet. 2016. PMID: 27589388 Free PMC article.
References
-
- Narici MV, Maffulli N. Sarcopenia: characteristics, mechanisms and functional significance. Br Med Bull. 2010;95:139–159. - PubMed
-
- Rosenberg IR. Summary comments. The American journal of clinical nutrition. 1989;50:1231–1233.
-
- Brack AS, Bildsoe H, Hughes SM. Evidence that satellite cell decrement contributes to preferential decline in nuclear number from large fibres during murine age-related muscle atrophy. J Cell Sci. 2005;118:4813–4821. - PubMed
-
- Rai M, Nongthomba U, Grounds MD. Skeletal muscle degeneration and regeneration in mice and flies. Curr Top Dev Biol. 2014;108:247–281. - PubMed
-
- Kadi F, Ponsot E. The biology of satellite cells and telomeres in human skeletal muscle: effects of aging and physical activity. Scand J Med Sci Sports. 2010;20:39–48. - PubMed
Publication types
MeSH terms
Substances
Grants and funding
LinkOut - more resources
Full Text Sources
Other Literature Sources
Molecular Biology Databases

