Common clonal origin of central and resident memory T cells following skin immunization
- PMID: 25962122
- PMCID: PMC4632197
- DOI: 10.1038/nm.3860
Common clonal origin of central and resident memory T cells following skin immunization
Abstract
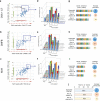
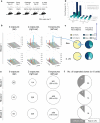
Central memory T (TCM) cells in lymph nodes (LNs) and resident memory T (TRM) cells in peripheral tissues have distinct roles in protective immunity. Both are generated after primary infections, but their clonal origins have been unclear. To address this question, we immunized mice through the skin with a protein antigen, a chemical hapten, or a non-replicating poxvirus. We then analyzed antigen-activated T cells from different tissues using high-throughput sequencing (HTS) of the gene encoding the T cell receptor (TCR) β-chain (Trb, also known as Tcrb) using CDR3 sequences to simultaneously track thousands of unique T cells. For every abundant TRM cell clone generated in the skin, an abundant TCM cell clone bearing the identical TCR was present in the LNs. Thus, antigen-reactive skin TRM and LN TCM cell clones were derived from a common naive T cell precursor after skin immunization, generating overlapping TCR repertoires. Although they bore the same TCR, TRM cells mediated rapid contact hypersensitivity responses, whereas TCM cells mediated delayed and attenuated responses. Studies in human subjects confirmed the generation of skin TRM cells in allergic contact dermatitis. Thus, immunization through skin simultaneously generates skin TRM and LN TCM cells in similar numbers from the same naive T cells.
Figures


Comment in
-
Unpleasant memories: tissue-embedded T cell memory drives skin hypersensitivity.Nat Med. 2015 Jun;21(6):551-2. doi: 10.1038/nm.3874. Nat Med. 2015. PMID: 26046572 No abstract available.
Similar articles
-
Maintenance of the human memory T cell repertoire by subset and tissue site.Genome Med. 2021 Jun 14;13(1):100. doi: 10.1186/s13073-021-00918-7. Genome Med. 2021. PMID: 34127056 Free PMC article.
-
Cross-talk between V beta 8+ and gamma delta+ T lymphocytes in contact sensitivity.Immunology. 1998 Apr;93(4):469-77. doi: 10.1046/j.1365-2567.1998.00435.x. Immunology. 1998. PMID: 9659217 Free PMC article.
-
T Cell Receptor Beta-Chain Profiling of Tumor Tissue, Peripheral Blood and Regional Lymph Nodes From Patients With Papillary Thyroid Carcinoma.Front Immunol. 2021 Feb 18;12:595355. doi: 10.3389/fimmu.2021.595355. eCollection 2021. Front Immunol. 2021. PMID: 33679738 Free PMC article.
-
Allergic contact dermatitis.Curr Dir Autoimmun. 2008;10:1-26. doi: 10.1159/000131410. Curr Dir Autoimmun. 2008. PMID: 18460878 Review.
-
Possible Immune Regulation of Natural Killer T Cells in a Murine Model of Metal Ion-Induced Allergic Contact Dermatitis.Int J Mol Sci. 2016 Jan 12;17(1):87. doi: 10.3390/ijms17010087. Int J Mol Sci. 2016. PMID: 26771600 Free PMC article. Review.
Cited by
-
Systemic and skin-limited delayed-type drug hypersensitivity reactions associate with distinct resident and recruited T cell subsets.J Clin Invest. 2024 Jul 23;134(17):e178253. doi: 10.1172/JCI178253. J Clin Invest. 2024. PMID: 39042477 Free PMC article.
-
The role of circulating T cells with a tissue resident phenotype (ex-TRM) in health and disease.Front Immunol. 2024 May 16;15:1415914. doi: 10.3389/fimmu.2024.1415914. eCollection 2024. Front Immunol. 2024. PMID: 38817613 Free PMC article. Review.
-
Inflammatory Memory in Chronic Skin Disease.JID Innov. 2024 Mar 22;4(3):100277. doi: 10.1016/j.xjidi.2024.100277. eCollection 2024 May. JID Innov. 2024. PMID: 38708420 Free PMC article. Review.
-
Opportunities and challenges for T cell-based influenza vaccines.Nat Rev Immunol. 2024 Oct;24(10):736-752. doi: 10.1038/s41577-024-01030-8. Epub 2024 May 2. Nat Rev Immunol. 2024. PMID: 38698082 Review.
-
Tissue-resident memory T cells: decoding intra-organ diversity with a gut perspective.Inflamm Regen. 2024 Apr 17;44(1):19. doi: 10.1186/s41232-024-00333-6. Inflamm Regen. 2024. PMID: 38632596 Free PMC article. Review.
References
-
- Clark RA, et al. The vast majority of CLA+ T cells are resident in normal skin. J Immunol. 2006;176:4431–4439. - PubMed
-
- Gebhardt T, Mueller SN, Heath WR, Carbone FR. Peripheral tissue surveillance and residency by memory T cells. Trends Immunol. 2013;34:27–32. - PubMed
-
- Lanzavecchia A, Sallusto F. Understanding the generation and function of memory T cell subsets. Curr Opin Immunol. 2005;17:326–332. - PubMed
Publication types
MeSH terms
Substances
Grants and funding
LinkOut - more resources
Full Text Sources
Other Literature Sources
Molecular Biology Databases

