. 2015 May 7:6:7068.
doi: 10.1038/ncomms8068.

IκBβ enhances the generation of the low-affinity NFκB/RelA homodimer

Affiliations

IκBβ enhances the generation of the low-affinity NFκB/RelA homodimer

Rachel Tsui et al. Nat Commun. .

Abstract

The NFκB family of dimeric transcription factors regulate inflammatory and immune responses. While the dynamic control of NFκB dimer activity via the IκB-NFκB signalling module is well understood, there is little information on how specific dimer repertoires are generated from Rel family polypeptides. Here we report the iterative construction-guided by in vitro and in vivo experimentation-of a mathematical model of the Rel-NFκB generation module. Our study reveals that IκBβ has essential functions within the Rel-NFκB generation module, specifically for the RelA:RelA homodimer, which controls a subset of NFκB target genes. Our findings revise the current dogma of the three classical, functionally related IκB proteins by distinguishing between a positive 'licensing' factor (IκBβ) that contributes to determining the available NFκB dimer repertoire in a cell's steady state, and negative feedback regulators (IκBα and -ɛ) that determine the duration and dynamics of the cellular response to an inflammatory stimulus.


Conflict of interest statement

Competing interests: The authors declare no conflicts of interest.

Figures

Figure 1
Figure 1. Monomer competition reduces the abundance of the RelA homodimer
A. A schematic of a simple model depicting the dimerization of NFκB RelA and p50 polypeptides. m1 and m2 are synthesis rate constants, m−1 and m−2 are degradation rate constants. d1, d2, and d3 are dimer association rate constants, while d−1, d−2, and d−3 are dimer dissociation rate constants. dd−1, dd−2, and dd−3 are dimer degradation rate constants. B. Heat maps of protein abundances of A:A and A:50 dimers computationally simulated as a function of the dimer affinities (Kd). These were generated by the model schematized in (A). C. Electrophoretic mobility shift assays (EMSA) with nuclear extracts prepared from TNF-stimulated (30 min) wild type mouse embryonic fibroblasts (MEFs). The identity of the indicated DNA-protein complexes were confirmed using competition (comp.) with a 100-fold excess of unlabeled double stranded oligonucleotide that either contains the wild type (wt) or mutant (mt) κB site sequence. The RelA and p50 antibody (α–RelA and α-p50) are used in shift-ablation studies to confirm that the identity of the A:A-DNA and A:50-DNA complexes. D. EMSA with nuclear extracts prepared from TNF-stimulated (30 min) wild type and nfkb1−/− MEFs. E. Bar graph comparison of the abundances of A:A NFκB dimers wild type and nfkb1−/− relative to the wild type A:50 bands (100%) from panel (D).
Figure 2
Figure 2. Biophysical kinetic model underestimates the abundance of the RelA homodimer
A. Summary table of dimer affinities as measured by analytical ultracentrifugation (AUC) and quantitative gel-filtration analysis of purified recombinant proteins (Supplemental Figure 1B–E). The A:A homodimer affinity is lower than those of p50-containing dimers. B. The bar graph is a quantitation from Figure 1 showing a comparison of model predicted (blue) and experimentally measured (red) relative abundances of A:A and A:50 dimers.
Figure 3
Figure 3. Differential interaction affinities for IκB and NFκB family members
A. A model schematic of the Rel-NFκB dimer generation module. It depicts the dimerization of RelA and p50 NFκB polypeptides as in Figure 1A, with the addition of a prototypical inhibitor of NFκB (IκB). m1 and m2 are RelA and p50 synthesis rate constants, m−1 and m−2 are RelA and p50 degradation rate constants. d1, d2, and d3 are dimer association rate constants, while d−1, d−2, and d−3 are A:A, A:p50, and p50:p50 dimer dissociation rate constants. dd−1, dd−2, and dd−3 are A:A, A:p50, and p50:p50 dimer degradation rate constants. i1 is the IκB synthesis rate constant, i−1 is the IκB degradation rate constant. di1 and di2 are the IκB-NFκB association rate constants. di−1 and di−2 are the IκB-NFκB dissociation rate constants. did1 and did2 are the IκB-NFκB degradation rate constants of IκB to release NFκB. B. Immunoblot (left panel) of whole cell extracts of wild type MEFs and MEFs deficient in canonical NFκB genes (RelA, cRel, and p50) using antibodies against the indicated proteins (IκBα, IκBβ, and IκBε). RNAse protection assay (RPA, right panel) of previous extracts to measure transcript levels of the indicated genes (IκBα, IκBβ, IκBε, and L32). Immunoblot and RPA data are representative of more than three independent experiments that consistently show a deep reduction IκB protein levels without a corresponding reduction in transcript levels. C. Immunoblot of indicated IκBs in indicated NFκB dimer compound knockout MEFs as compared to wild type MEFs, with the indicated NFκB dimers below. The blot is a representative of three independent experiments that consistently showed that presence of RelA is required and sufficient for the detection of IκBβ protein. Quantitation of this data is shown as bar graphs in Figure 4A.
Figure 4
Figure 4. Deriving probable IκB-NFκB interaction affinities from experimental data
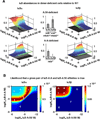
A. Surface plots of indicated IκB abundances (−α or −β) in cells deficient for the indicated NFκB dimer (RelA:p50 heterodimer-deficient, top; RelA:RelA homodimer-deficient, bottom) over the indicated ranges of IκB-NFκB affinities, as predicted by the model schematized in Figure 3A. Middle, bar graphs of the experimentally IκB abundances in the indicated NFκB dimer-deficient cells relative to WT. (A representative data figure is shown in Figure 3C.) Experimentally determined abundances constrained the range of allowable IκB-NFκB affinities in the surface plots, indicated by shadows on the xy-plane. B. Heat maps of probable IκB-NFκB affinities. Probabilities (indicated in the color scale) were calculated using the distribution experimental measurements, defined by mean and standard deviation (Figure 2A, Figure 3C, Figure 4A); they describe the relative likelihood that an indicate parameter set if correct based on available experimental data. The most probable IκB-NFκB affinities are in red, while the least probable affinities are in dark blue. Selected probable and improbable parameter values are indicated (white letters and numbers, listed in Supplementary Table 5), and were used for model predictions in Figure 5.
Figure 5
Figure 5. Iterative testing and refinement of the IκBβ -RelA homodimer preference model
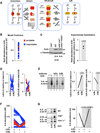
A. A model schematic of the Rel-NFκB dimer generation module, as in Figure 3A but with two IκBs, IκBα and IκBβ, necessitating i1 and i2 synthesis rate constants, i−1 and i−2 degradation rate constants, di1,di2, di3, and di4 IκB-NFκB association rate constants. di−1, di−2, di−3, and di−4 IκB-NFκB dissociation rate constants, and did1, did2, did3, and did4 IκB-NFκB degradation rate constants of IκB to release NFκB. B. Computational prediction of RelA protein abundance in A:50-deficient cells (relative to wild type cells), using probable (red) and improbable (blue) affinities shown in Figure 4B and listed in Supplementary Table 5. C. Immunoblot against RelA of whole cell extracts from RelA-deficient, wild type, and RelA-only MEFs. The right panel shows the quantitation of three independent experiments. These consistently showed values of > 0.5. D. Computational predictions of the abundances of NFκB dimers RelA:RelA (left) and RelA:p50 (right) bound to either IκBα or IκBβ as indicated. These calculations used probable (red) and improbable affinities (blue) as in panel B. E. Electrophoretic mobility shift assay of deoxycholate (DOC)-treated cytoplasmic extracts (which results in the separation of NFκB dimers from IκBs) to quantitate IκB-bound NFκB dimer abundance. Prior immunodepletion of the extracts with antibodies against IκBα or IκBβ allows quantitation of NFκB bound to the remaining IκB isoform. Data shown is representative of three independent experiments, and the right panel shows the corresponding quantitation. F. Computational predictions of the basal abundances of the RelA:RelA homodimer in wild type, IκBβ -deficient, and IκBα-deficient MEFs using probable (red) and improbable (blue) affinities as in panel B. G. Electrophoretic mobility shift assays (left panel) of DOC-treated cytoplasmic extracts of wild type, IκBβ -deficient, and IκBα/ε-deficient MEFs. Shown is a representative result of three independent experiments, and the right panel shows the corresponding quantitation.
Figure 6
Figure 6. IκBβ is important in RelA homodimer formation
A. Bar graph depicting the simulation results of NFκB dimer abundances in wild type, IκBβ -deficient, p50-deficient, and IκBβ /p50 doubly deficient MEFs. Compensation by p52 in p50-deficient cells was simulated by allowing for synthesis of a p50-like molecular species. B. Electrophoretic shift mobility assay of nuclear extracts prepared from p50- deficient and p50/IκBβ -deficient MEFs treated with TNF at 10 and 30 minutes. In the absence of p50-mediated monomer competition, the RelA:RelA homodimer is highly abundant, even in the absence of IκBβ. Data shown is representative of three independent experiments.
Figure 7
Figure 7. While IκBβ regulates NFκB/RelA homodimer generation, IκBα regulates its signaling
A. A schematic showing the linking of the Rel-NFκB dimer generation module and the IκB-NFκB signaling module (20) to simulate stimulus-induced activation of multiple NFκB dimers. IκBα, IκBβ, and IκBε interact with A:A and A:50 dimers as described in Figure 5A. A detailed model schematic is shown in Supplemental Figure 5A. B. Computational time course simulations of TNF-stimulated nuclear DNA binding activity of the indicated NFκB dimers A:50 (left, solid lines) and A:A (right, dashed lines) in wild type (blue) and IκBα-deficient (red) MEFs. Both dimer activities exhibit post-induction repression mediated by IκBα. C. Electrophoretic mobility shift assays (top panels) of nuclear extracts of wild-type and IκBα-deficient MEFs prepared from TNF-stimulated cells at 30, 60 and 90 minutes. Quantitation (bottom panels) of the A:50 (solid lines) A:A and A:50 (dashed lines) NFκB dimers show prolonged activation in IκBα deficient (right, red) as compared to wild-type (left, blue) MEFs. Shown is a representative of at least three independent experiments. D. Computational simulations of A:A abundance (green) and duration of TNF-induced A:A activity (purple) as a function of the interaction affinity between IκBα and the A:A. These simulations were performed with the integrated model described in (A), and they show that a lower Kd would allow IκBα to contribute to A:A generation, while a higher Kd would reduce IκBα’s ability to terminate TNF-induced A:A activity.

Similar articles

Cited by

References

    1. Hoffmann A, Natoli G, Ghosh G. Transcriptional regulation via the NF-kappaB signaling module. Oncogene. 2006;25:6706–6716. - PubMed
    1. Ghosh S, Hayden MS. New regulators of NF-kappaB in inflammation. Nat. Rev. Immunol. 2008;8:837–848. - PubMed
    1. Savinova OV, Hoffmann A, Ghosh G. The Nfkb1 and Nfkb2 proteins p105 and p100 function as the core of high-molecular-weight heterogeneous complexes. Mol. Cell. 2009;34:591–602. - PMC - PubMed
    1. Basak S, Behar M, Hoffmann A. Lessons from mathematically modeling the NF-κB pathway. Immunol. Rev. 2012;246:221–238. - PMC - PubMed
    1. Rao P, et al. IκBβ acts to inhibit and activate gene expression during the inflammatory response. Nature. 2010;466:1115–1119. - PMC - PubMed

Publication types