Fc Engineering of Human IgG1 for Altered Binding to the Neonatal Fc Receptor Affects Fc Effector Functions
- PMID: 25904551
- PMCID: PMC4432726
- DOI: 10.4049/jimmunol.1401218
Fc Engineering of Human IgG1 for Altered Binding to the Neonatal Fc Receptor Affects Fc Effector Functions
Abstract
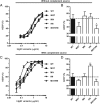
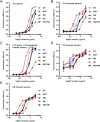
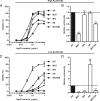
Engineering of the constant Fc part of monoclonal human IgG1 (hIgG1) Abs is an approach to improve effector functions and clinical efficacy of next-generation IgG1-based therapeutics. A main focus in such development is tailoring of in vivo half-life and transport properties by engineering the pH-dependent interaction between IgG and the neonatal Fc receptor (FcRn), as FcRn is the main homeostatic regulator of hIgG1 half-life. However, whether such engineering affects binding to other Fc-binding molecules, such as the classical FcγRs and complement factor C1q, has not been studied in detail. These effector molecules bind to IgG1 in the lower hinge-CH2 region, structurally distant from the binding site for FcRn at the CH2-CH3 elbow region. However, alterations of the structural composition of the Fc may have long-distance effects. Indeed, in this study we show that Fc engineering of hIgG1 for altered binding to FcRn also influences binding to both the classical FcγRs and complement factor C1q, which ultimately results in alterations of cellular mechanisms such as Ab-dependent cell-mediated cytotoxicity, Ab-dependent cellular phagocytosis, and Ab-dependent complement-mediated cell lysis. Thus, engineering of the FcRn-IgG1 interaction may greatly influence effector functions, which has implications for the therapeutic efficacy and use of Fc-engineered hIgG1 variants.
Copyright © 2015 by The American Association of Immunologists, Inc.
Figures


Similar articles
-
An engineered Fc variant of an IgG eliminates all immune effector functions via structural perturbations.Methods. 2014 Jan 1;65(1):114-26. doi: 10.1016/j.ymeth.2013.06.035. Epub 2013 Jul 17. Methods. 2014. PMID: 23872058
-
Design and characterization of novel dual Fc antibody with enhanced avidity for Fc receptors.Proteins. 2020 May;88(5):689-697. doi: 10.1002/prot.25853. Epub 2019 Nov 20. Proteins. 2020. PMID: 31702857 Free PMC article.
-
Global conformational changes in IgG-Fc upon mutation of the FcRn-binding site are not associated with altered antibody-dependent effector functions.Biochem J. 2018 Jul 5;475(13):2179-2190. doi: 10.1042/BCJ20180139. Biochem J. 2018. PMID: 29794155
-
Neonatal Fc receptor (FcRn): a novel target for therapeutic antibodies and antibody engineering.J Drug Target. 2014 May;22(4):269-78. doi: 10.3109/1061186X.2013.875030. Epub 2014 Jan 9. J Drug Target. 2014. PMID: 24404896 Review.
-
Are endosomal trafficking parameters better targets for improving mAb pharmacokinetics than FcRn binding affinity?Mol Immunol. 2013 Dec;56(4):660-74. doi: 10.1016/j.molimm.2013.05.008. Epub 2013 Aug 2. Mol Immunol. 2013. PMID: 23917469 Review.
Cited by
-
Fc-engineered antibodies promote neutrophil-dependent control of Mycobacterium tuberculosis.Nat Microbiol. 2024 Sep;9(9):2369-2382. doi: 10.1038/s41564-024-01777-9. Epub 2024 Aug 22. Nat Microbiol. 2024. PMID: 39174703 Free PMC article.
-
Exploiting the neonatal crystallizable fragment receptor to treat kidney disease.Kidney Int. 2024 Jan;105(1):54-64. doi: 10.1016/j.kint.2023.09.024. Epub 2023 Oct 29. Kidney Int. 2024. PMID: 38707675 Review.
-
Human IgG Fc-engineering for enhanced plasma half-life, mucosal distribution and killing of cancer cells and bacteria.Nat Commun. 2024 Mar 7;15(1):2007. doi: 10.1038/s41467-024-46321-9. Nat Commun. 2024. PMID: 38453922 Free PMC article.
-
Impact of structural modifications of IgG antibodies on effector functions.Front Immunol. 2024 Jan 8;14:1304365. doi: 10.3389/fimmu.2023.1304365. eCollection 2023. Front Immunol. 2024. PMID: 38259472 Free PMC article. Review.
-
Interactions of the anti-FcRn monoclonal antibody, rozanolixizumab, with Fcγ receptors and functional impact on immune cells in vitro.MAbs. 2024 Jan-Dec;16(1):2300155. doi: 10.1080/19420862.2023.2300155. Epub 2024 Jan 19. MAbs. 2024. PMID: 38241085 Free PMC article.
References
-
- Chan A. C., Carter P. J. 2010. Therapeutic antibodies for autoimmunity and inflammation. Nat. Rev. Immunol. 10: 301–316. - PubMed
-
- Idusogie E. E., Presta L. G., Gazzano-Santoro H., Totpal K., Wong P. Y., Ultsch M., Meng Y. G., Mulkerrin M. G. 2000. Mapping of the C1q binding site on rituxan, a chimeric antibody with a human IgG1 Fc. J. Immunol. 164: 4178–4184. - PubMed
-
- Natsume A., In M., Takamura H., Nakagawa T., Shimizu Y., Kitajima K., Wakitani M., Ohta S., Satoh M., Shitara K., Niwa R. 2008. Engineered antibodies of IgG1/IgG3 mixed isotype with enhanced cytotoxic activities. Cancer Res. 68: 3863–3872. - PubMed
Publication types
MeSH terms
Substances
LinkOut - more resources
Full Text Sources
Other Literature Sources

