. 2015 Apr 28;11(4):577-91.
doi: 10.1016/j.celrep.2015.03.055. Epub 2015 Apr 16.

Intratumoral myeloid cells regulate responsiveness and resistance to antiangiogenic therapy

Affiliations

Intratumoral myeloid cells regulate responsiveness and resistance to antiangiogenic therapy

Lee B Rivera et al. Cell Rep. .

Abstract

Antiangiogenic therapy is commonly used in the clinic, but its beneficial effects are short-lived, leading to tumor relapse within months. Here, we found that the efficacy of angiogenic inhibitors targeting the VEGF/VEGFR pathway was dependent on induction of the angiostatic and immune-stimulatory chemokine CXCL14 in mouse models of pancreatic neuroendocrine and mammary tumors. In response, tumors reinitiated angiogenesis and immune suppression by activating PI3K signaling in all CD11b+ cells, rendering tumors nonresponsive to VEGF/VEGFR inhibition. Adaptive resistance was also associated with an increase in Gr1+CD11b+ cells, but targeting Gr1+ cells was not sufficient to further sensitize angiogenic blockade because tumor-associated macrophages (TAMs) would compensate for the lack of such cells and vice versa, leading to an oscillating pattern of distinct immune-cell populations. However, PI3K inhibition in CD11b+ myeloid cells generated an enduring angiostatic and immune-stimulatory environment in which antiangiogenic therapy remained efficient.


Figures

Figure 1
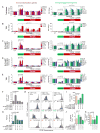
Figure 1. Targeting distinct myeloid populations induces compensatory oscillation
(A) Tumor burden of RT2 mice. Response indicates tumor stasis (two week sorafenib treatment) and relapse indicates tumor regrowth (four week sorafenib treatment). (B) Microvessel density of immunofluorescent anti-CD31 stained tumors. (C) Myeloid cell composition in RT2 PNET by FACS. P=0.0248 for relapse versus response phase Gr1+Ly6CHi cells. (D–F) Tumor burden (D), microvessel density (E), and myeloid cell composition (F) in mice treated with sorafenib plus anti-Gr1. P=0.01 for TAM versus sorafenib response phase TAM; p=0.007 for Gr1+Ly6CHi cells and TAM versus cognate populations in sorafenib relapse tumors. (G–I) Tumor burden (G), microvessel density (H) and myeloid cell composition (I) in mice treated with sorafenib plus anti-CSF1. P<0.05 for TAM, Gr1+Ly6CHi and Gr1+Ly6GHi cells versus cognate populations in both sorafenib response and relapse phase tumors. Scale bars,100μm. Mean±SEM is presented for all quantitation. For Figures 1D–1I, data is presented with untreated and sorafenib response tumor data from Figures 1A–1C. See also Figures S1 and S2, and Experimental Procedures for details.
Figure 2
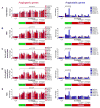
Figure 2. Antiangiogenic therapy regulates both angiogenic and angiostatic gene expression in myeloid cells
(A) QPCR-based expression analyses of proangiogenic and angiostatic genes in RT2 tumors. (B–E) QPCR expression analysis of FACS-sorted TAMs (B), Gr1+Ly6CHi monocytes (C), Gr1+Ly6GHi monocytes (D), and TAN (E) isolated from tumors treated as indicated. Dotted lines indicate baseline gene expression in untreated samples. Mean±SEM is presented for quantitation and p values calculated comparing each treatment group to untreated (UT). See also Figure S3.
Figure 3
Figure 3. Myeloid CXCL14 induction is necessary for sorafenib to elicit an antiangiogenic response
(A) Aortic slice assay using CD11b+ cell extracts from untreated and treated RT2 tumors as indicated. Endothelial cell migration from the aortic slice into the surrounding collagen matrix was assessed by immunofluorescent staining of CD31. Quantitation of migrating cells per slice is presented in the right panel. *p<0.01. (B) Tumor burden of RT2 mice treated with either anti-CXCL14 or control IgG antibody plus sorafenib. (C) CD31 staining and quantitation of microvessel density of RT2 tumors. Data from untreated and four week sorafenib-treated mice is presented from Figures 1A and 1B in Figures 3B and 3C for comparison. Mean±SEM is presented for all quantitation.
Figure 4
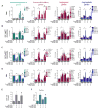
Figure 4. Antiangiogenic therapy induces myeloid cell polarization
(A–E) QPCR RNA analyses of immune-modulating genes from RT2 tumors (A), RT2 tumor-isolated TAM (B), Gr1+Ly6CHi (C) and Gr1+Ly6GHi monocytes (D), or TAN (E) untreated and treated as indicated. P values are calculated by compariing total untreated gene expression. (F) FACS-analysis of intratumoral CD8+ CTLs. (G) QPCR analysis of Perforin in CD8+ CTLs. (H) CFSE-based proliferation assay of CD8+ T-cells cocultured with the splenic myeloid populations from RT2 mice treated as indicated. (I–K) Tumor burden (I), apoptosis (J), and microvessel density from mice treated concurrently with sorafenib plus anti-CD8a compared to untreated and sorafenib relapse data from Figures 1A and 1B. Mean±SEM is presented for all quantitations. UT=untreated, Resp=response (two week sorafenib), Rel=relapse (four week sorafenib), mito=Mitomycin C. See also Figure S4 and Supplementary Experimental Procedures for details.
Figure 5
Figure 5. The PI3K γ/δ inhibitor IPI145 enhances efficacy of antiangiogenic therapy
(A) Key downstream effectors of the PI3K signaling pathway. (B) Phospho-S6 (pS6) and CD11b immunofluorescent staining in RT2 PNET. Quantitation of CD11b+ phospho-S6+ cells is shown to the right; **p<0.005 versus sorafenib 2 weeks; ###p<0.0005 versus sorafenib four weeks alone and plus antibodies. (C) CD45 and phospho-S6 staining and quantitation from PNET tumor samples of patients treated as indicated. Each dot represents one patient.. Scale bars, 7.5 um. (D and E) Tumor microvessel density (D) and burden (E) from mice treated with sorafenib plus IPI145 versus untreated and sorafenib-response phase tumors from Figures 1B and 1A. (F) Survival of RT2 mice treated with vehicle (n=4; median survival=102 days), sorafenib (n=4; median survival=118.5 days), sorafenib+IPI145 (n=10; median survival=144 days), or IPI145 alone (n=4; median survival=102 days). ns=no significance versus vehicle, *p=0.0266 versus vehicle, #p=0.00068 versus sorafenib. Vertical dashed line indicates the start of sorafenib treatment (91 days); red dotted line indicates 50% survival. (G) Myeloid cell composition of tumors treated with sorafenib plus IPI145 compared to untreated and sorafenib-treated tumors from Figure 1C. P≤0.05 for Gr1+Ly6CHi monocytes and TAM from four week sorafenib alone versus four week sorafenib plus IPI145. (H and I) QPCR- analyses of immune- (H) or angiogenesis- (I) modulating genes from RT2 tumors. PNET treated with sorafenib plus IPI145 are compared to untreated and sorafenib-treated tumors from Figure 3A. P values were calculated by comparing each treatment to untreated (UT). Dotted lines indicate baseline gene expression in untreated samples. Mean±SEM is presented for all quantitations. See also Figure S5.
Figure 6
Figure 6. IPI145 induces immune stimulatory and angiostatic factors in myeloid cells during antiangiogenic therapy
(A–D) QPCR analyses of TAM (A), Gr1+Ly6CHi (B) and Gr1+Ly6GHi monocytes (C), and TAN (D) from tumors of RT2 mice treated with sorafenib −/+ IPI145. P values calculated comparing each treatment group to untreated (UT). (E) CD8+ CTLs from tumors of mice treated with sorafenib plus IPI145.(F) Perforin expression in CD8+ CTLs from tumors of mice treated with sorafenib plus IPI145. Dotted lines indicate baseline gene expression in untreated samples. *p≤0.05 versus untreated; #p≤0.05 versus 4 week sorafenib alone. Data from untreated and sorafenib-treated tumors from Figures 2B–2E, 4B–4G are presented in 6A–6F for comparison. Mean±SEM is presented for all quantitation.
Figure 7
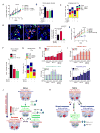
Figure 7. Myeloid PI3K limits antiangiogenic therapy in PyMT tumors
(A) PyMT tumor growth. *p<0.05 for treatment groups versus control at day 12. Data represents at least six mice per group. (B) Microvessel density of tumors at 12 day- treatment.*p< 0.05 versus control. (C) Intratumoral myeloid cell composition at 12day treatment. P< 0.05 for TAM, Gr1+Ly6GHi monocytes, and TAN from DC101 alone versus DC101 plus anti-Gr1; p<0.05 for TAM and TAN from DC101 versus DC101 plus anti-CSF1 at 12 days. (D) CD11b+ Phospho-S6 (pS6) staining and quantification of PyMT tumors. Scale bars, 5 um. (E) Tumor growth in mice treated with IPI145 as indicated. *p< 0.05 for DC101, IPI145 versus control at day 12; #p< 0.05 for DC101 plus IPI145 versus DC101 at day 12. Data represents at least six mice per group. (F and G) Microvessel density (F) and myeloid cell composition (G) in tumors after 12 day- treatment. *p< 0.05 versus control at 12 days. P<0.05 for TAM and TAN in DC101 plus IPI145 versus cognate populations in DC101 alone. (H and I) QPCR analyses of immune- (H) and angiogenesis- (I) modulating genes (H) after 4 and 12 days therapy. *p< 0.05 versus four day control; #p< 0.05 versus 12 day control. Dotted lines indicate baseline gene expression in control samples. Mean±SEM is presented for all quantitations (J and K). Summary of response to antiangiogenic therapy in RT2 (J) and PyMT (K) models. (J) Myeloid cells in naïve RT2 PNET exhibit a “PI3K-off” M2 phenotype. Angiogenesis inhibitors skew myeloid cells towards a CXCL14-expressing M1 phenotype; these promote tumor response by impeding angiogenesis and facilitating anti-tumor immunity. In turn, tumors activate myeloid PI3K-signaling, likely by increasing SDF1α and IL-6. PI3K-activated myeloid cells display a highly angiogenic and immune-suppressive M2* phenotype. M2* myeloid cells convey resistance to therapy by blocking anti-tumor immunity and promoting angiogenesis. IPI145 blocks the acquisition of the M2* phenotype, resulting in sustained tumor response. (K) Myeloid cells within PyMT tumors are both M2 and M2*. Antiangiogenic therapy alone skews M2 cells towards an M1 phenotype without affecting M2* cells, while IPI145 alone converts M2* cells to an M1 phenotype and does not influence M2 cells. Thus, either treatment elicits only partial responses while combining angiogenesis inhibitors and IPI145 results in conversion of both M2 and M2* cells to the M1 phenotype, thus enhancing tumor response. See Discussion for details and also Figures S6 and S7.

Similar articles

Cited by

References

    1. Anisimov A, Tvorogov D, Alitalo A, Leppanen VM, An Y, Han EC, Orsenigo F, Gaal EI, Holopainen T, Koh YJ, et al. Vascular endothelial growth factor-angiopoietin chimera with improved properties for therapeutic angiogenesis. Circulation. 2013;127:424–434. - PubMed
    1. Baeriswyl V, Christofori G. The angiogenic switch in carcinogenesis. Seminars in cancer biology. 2009;19:329–337. - PubMed
    1. Barrios CS, Johnson BD, Henderson J, Fink JN, Kelly KJ, Kurup VP. The costimulatory molecules CD80, CD86 and OX40L are up-regulated in Aspergillus fumigatus sensitized mice. Clinical and experimental immunology. 2005;142:242–250. - PMC - PubMed
    1. Bergers G, Hanahan D. Modes of resistance to anti-angiogenic therapy. Nature reviews Cancer. 2008;8:592–603. - PMC - PubMed
    1. Carmeliet P, Jain RK. Angiogenesis in cancer and other diseases. Nature. 2000;407:249–257. - PubMed

Publication types

MeSH terms

Substances