Complementary Assays Reveal a Low Level of CA Associated with Viral Complexes in the Nuclei of HIV-1-Infected Cells
- PMID: 25741002
- PMCID: PMC4442523
- DOI: 10.1128/JVI.00476-15
Complementary Assays Reveal a Low Level of CA Associated with Viral Complexes in the Nuclei of HIV-1-Infected Cells
Abstract
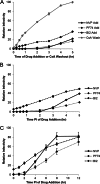
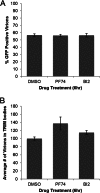
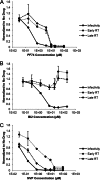
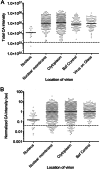
During uncoating, the conical capsid of HIV disassembles by dissociation of the p24 capsid protein (CA). Uncoating is known to be required for HIV replication, but the mechanism is poorly defined. Here, we examined the timing and effect of two capsid binding drugs (PF74 and BI2) on infectivity and capsid integrity in HIV-1-infected cells. The virus remained susceptible to the action of PF74 and BI2 for hours after uncoating as defined in parallel drug addition and cyclosporine (CsA) washout assays to detect the kinetics of drug susceptibility and uncoating, respectively. Resistance mutations in CA decreased the potency of these compounds, demonstrating that CA is the target of drug action. However, neither drug altered capsid integrity in a fluorescence microscopy-based assay. These data suggest that PF74 and BI2 do not alter HIV-1 uncoating but rather affect a later step in viral replication. Because both drugs bind CA, we hypothesized that a residual amount of CA associates with the viral complex after the loss of the conical capsid to serve as a target for these drugs. Superresolution structured illumination microscopy (SIM) revealed that CA localized to viral complexes in the nuclei of infected cells. Using image quantification, we determined that viral complexes localized in the nucleus displayed a smaller amount of CA than complexes at the nuclear membrane, in the cytoplasm, or in controls. Collectively, these data suggest that a subset of CA remains associated with the viral complex after uncoating and that this residual CA is the target of PF74 and BI2.
Importance: The HIV-1 capsid is a target of interest for new antiviral therapies. This conical capsid is composed of monomers of the viral CA protein. During HIV-1 replication, the capsid must disassemble by a poorly defined process called uncoating. CA has also been implicated in later steps of replication, including nuclear import and integration. In this study, we used cell-based assays to examine the effect of two CA binding drugs (PF74 and BI2) on viral replication in infected cells. HIV-1 was susceptible to both drugs for hours after uncoating, suggesting that these drugs affect later steps of viral replication. High-resolution structured illumination microscopy (SIM) revealed that a subset of CA localized to viral complexes in the nuclei of cells. Collectively, these data suggest that a subset of CA remains associated with the viral complex after uncoating, which may facilitate later steps of viral replication and serve as a drug target.
Copyright © 2015, American Society for Microbiology. All Rights Reserved.
Figures


Similar articles
-
Roles of Capsid-Interacting Host Factors in Multimodal Inhibition of HIV-1 by PF74.J Virol. 2016 May 27;90(12):5808-5823. doi: 10.1128/JVI.03116-15. Print 2016 Jun 15. J Virol. 2016. PMID: 27076642 Free PMC article.
-
Identification of capsid mutations that alter the rate of HIV-1 uncoating in infected cells.J Virol. 2015 Jan;89(1):643-51. doi: 10.1128/JVI.03043-14. Epub 2014 Oct 22. J Virol. 2015. PMID: 25339776 Free PMC article.
-
PF74 Reinforces the HIV-1 Capsid To Impair Reverse Transcription-Induced Uncoating.J Virol. 2018 Sep 26;92(20):e00845-18. doi: 10.1128/JVI.00845-18. Print 2018 Oct 15. J Virol. 2018. PMID: 30089694 Free PMC article.
-
The Role of Capsid in HIV-1 Nuclear Entry.Viruses. 2021 Jul 22;13(8):1425. doi: 10.3390/v13081425. Viruses. 2021. PMID: 34452291 Free PMC article. Review.
-
Revisiting HIV-1 uncoating.Retrovirology. 2010 Nov 17;7:96. doi: 10.1186/1742-4690-7-96. Retrovirology. 2010. PMID: 21083892 Free PMC article. Review.
Cited by
-
Impact of Nucleoporin-Mediated Chromatin Localization and Nuclear Architecture on HIV Integration Site Selection.J Virol. 2015 Oct;89(19):9702-5. doi: 10.1128/JVI.01669-15. Epub 2015 Jul 1. J Virol. 2015. PMID: 26136574 Free PMC article. Review.
-
Characterization of Nuclear HIV-Induced Membraneless Organelles Through Fluorescence Microscopy.Methods Mol Biol. 2024;2807:113-125. doi: 10.1007/978-1-0716-3862-0_8. Methods Mol Biol. 2024. PMID: 38743224
-
Cell Type-Dependent Escape of Capsid Inhibitors by Simian Immunodeficiency Virus SIVcpz.J Virol. 2020 Nov 9;94(23):e01338-20. doi: 10.1128/JVI.01338-20. Print 2020 Nov 9. J Virol. 2020. PMID: 32907979 Free PMC article.
-
Roles of Capsid-Interacting Host Factors in Multimodal Inhibition of HIV-1 by PF74.J Virol. 2016 May 27;90(12):5808-5823. doi: 10.1128/JVI.03116-15. Print 2016 Jun 15. J Virol. 2016. PMID: 27076642 Free PMC article.
-
HIV-1 nuclear import in macrophages is regulated by CPSF6-capsid interactions at the nuclear pore complex.Elife. 2019 Jan 23;8:e41800. doi: 10.7554/eLife.41800. Elife. 2019. PMID: 30672737 Free PMC article.
References
-
- Tang S, Murakami T, Agresta BE, Campbell S, Freed EO, Levin JG. 2001. Human immunodeficiency virus type 1 N-terminal capsid mutants that exhibit aberrant core morphology and are blocked in initiation of reverse transcription in infected cells. J Virol 75:9357–9366. doi:10.1128/JVI.75.19.9357-9366.2001. - DOI - PMC - PubMed
-
- Tang S, Murakami T, Cheng N, Steven AC, Freed EO, Levin JG. 2003. Human immunodeficiency virus type 1 N-terminal capsid mutants containing cores with abnormally high levels of capsid protein and virtually no reverse transcriptase. J Virol 77:12592–12602. doi:10.1128/JVI.77.23.12592-12602.2003. - DOI - PMC - PubMed
Publication types
MeSH terms
Substances
Grants and funding
LinkOut - more resources
Full Text Sources
Other Literature Sources

