. 2015 Mar 9;212(3):351-67.
doi: 10.1084/jem.20140835. Epub 2015 Feb 9.

Immature myeloid cells directly contribute to skin tumor development by recruiting IL-17-producing CD4+ T cells

Affiliations

Immature myeloid cells directly contribute to skin tumor development by recruiting IL-17-producing CD4+ T cells

Myrna L Ortiz et al. J Exp Med. .

Abstract

Evidence links chronic inflammation with cancer, but cellular mechanisms involved in this process remain unclear. We have demonstrated that in humans, inflammatory conditions that predispose to development of skin and colon tumors are associated with accumulation in tissues of CD33+S100A9+ cells, the phenotype typical for myeloid-derived suppressor cells in cancer or immature myeloid cells (IMCs) in tumor-free hosts. To identify the direct role of these cells in tumor development, we used S100A9 transgenic mice to create the conditions for topical accumulation of these cells in the skin in the absence of infection or tissue damage. These mice demonstrated accumulation of granulocytic IMCs in the skin upon topical application of 12-O-tetradecanoylphorbol-13-acetate (TPA), resulting in a dramatic increase in the formation of papillomas during epidermal carcinogenesis. The effect of IMCs on tumorigenesis was not associated with immune suppression, but with CCL4 (chemokine [C-C motif] ligand 4)-mediated recruitment of IL-17-producing CD4+ T cells. This chemokine was released by activated IMCs. Elimination of CD4+ T cells or blockade of CCL4 or IL-17 abrogated the increase in tumor formation caused by myeloid cells. Thus, this study implicates accumulation of IMCs as an initial step in facilitation of tumor formation, followed by the recruitment of CD4+ T cells.


Figures

Figure 1.
Figure 1.
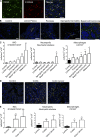
Myeloid cells in human tissues. (A) Example of staining of melanoma with CD33 and S100A9 antibody. (B) Typical example of staining of tissues from patients with different skin pathologies. (C) The number of different myeloid cells in skin. Each group included five patients. (D) Typical example of staining of tissues from patients with colitis and colon cancer. (A, B, and D) Bars, 50 µm. (E) The number of different myeloid cells in colonic tissues. Control and colon cancer groups included six patients and colitis group included five patients. (C and E) Mean and SD are shown. The differences from control: *, P < 0.05; **, P < 0.01; ***, P < 0.001.
Figure 2.
Figure 2.
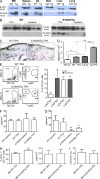
Accumulation of IMCs in skin of S100A9Tg mice. (A) Amount of S100A9 protein in various organs of WT and S100A9Tg mice. Typical example of Western blotting of 30 µg tissue protein is shown. (B) S100A9 protein in skin samples from WT and S100A9Tg mice treated with TPA or vehicle (acetone). Each lane represents an individual mouse. (C) Representative IHC images showing the presence of Gr-1+ cells in skin. Bar, 100 µm. (D) The number of Gr-1+ cells per square millimeter of skin tissue. (E) Phenotype of myeloid cells accumulated in skin of TPA-treated mice. Representative flow cytometry plots are shown with numbers indicating percentage of gated cells. Bar graph on the right illustrates the proportions of cell populations. (F and G) The number of F4/80+ (F) and CD11c+ (G) cells in skin of mice treated with TPA or acetone as indicated. (H and I) Proportion (left) and absolute number (right) of Gr-1+CD11b+ (H) and Ly6C/Ly6G ratio within the population of CD11b+ cells (I) in BM of TPA-treated mice. (D–I) Each group included four mice. Mean and SD are shown. *, P < 0.05; **, P < 0.01.
Figure 3.
Figure 3.
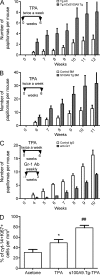
IMCs enhance papilloma formation. (A) Papilloma development in Tg.AC and S100A9Tg;Tg.AC bitransgenic mice after TPA treatment for 6 wk. Each group included seven mice. Two-way ANOVA, P = 0.0071. (B) Papilloma development in lethally irradiated Tg.AC mice that received BM from S100A9Tg or WT (control) mice. TPA treatment started 3 wk after the BM transfer. Each group included four mice. Two-way ANOVA, P = 0.035. (C) Papilloma development in S100A9Tg;Tg.AC mice treated with Gr-1 antibody and TPA as indicated in the graph. Each group included five mice. Two-way ANOVA, P < 0.001. (A and C) Mean and SD of the number of papillomas per mouse are shown. (D) Proliferation of keratinocytes in WT and S100A9Tg FVB/n mice treated for 5 wk with TPA. The proportion of proliferating Ki67+ cells among all cytokeratin 14+ keratinocytes was calculated in at least 100 cells. Each group included three mice. *, P < 0.05 between TPA- and acetone-treated WT mice; ##, P < 0.01 between TPA-treated WT and S100A9Tg mice. (B and D) Mean and SD are shown.
Figure 4.
Figure 4.
Lack of IMCs prevents tumor formation. (A) S100A9 protein in skin of C57BL/6 WT and S100A9KO mice treated with TPA or acetone vehicle. Each lane represents an individual mouse. Splenocytes from a tumor–bearing mouse were used as a positive control (PC). RP, recombinant protein. (B) The number of Gr-1+ cells in skin of C57BL/6 mice evaluated by IHC. Mice were treated with TPA or acetone for 4 wk. Each group included four mice. **, P < 0.01. (C) The number of papillomas in WT and S100A9KO C57BL/6 mice induced by DMBA and TPA as indicated. Each group included seven mice. P = 0.003. (D) Number of papillomas in lethally irradiated C57BL/6 mice that received BM from S100A9KO or WT (control) mice. Carcinogen treatment initiated 3 wk after the BM transfer. Each group included four mice. P < 0.001. (E) Number of papillomas in lethally irradiated C57BL/6 WT or S100A9KO mice that received BM from WT mice. Carcinogen treatment initiated 4 wk after the BM transfer. Each group included four mice (P > 0.1). (B–E) Mean and SD are shown.
Figure 5.
Figure 5.
IMCs lack suppressive activity. (A) Suppressive activity of Gr-1+ cells isolated from skin of S100A9Tg C57BL/6 mice treated for 6 wk with TPA. IMCs were added to splenocytes from OT-1 mice at the indicated ratios. Cells were incubated for 3 d in the presence of specific (SIINFEKL) or control (gp100) peptide. Proliferation was measured in triplicates by [3H]thymidine incorporation. Each experiment included three mice. (right) Antigen-specific suppressive assay with Gr-1+ MDSCs isolated from spleens of EL-4 tumor-bearing mice. Mean and SD are shown. **, P < 0.01 from no MDSC control. (B) Suppression activity of Gr-1+CD11b+ IMCs isolated from BM of mice treated with TPA. Allogeneic mixed lymphocyte reactions were performed using CD3-depleted irradiated FVB/N splenocytes as stimulators and BALB/c T cells as responders, mixed at 1:1 ratio. IMCs were added to the mix at the indicated ratios. Proliferation was measured in triplicates by [3H]thymidine incorporation (n = 3). Mean and SD are shown. (C) The phenotype of DCs isolated from skin of TPA-treated WT and S100A9Tg mice. Each group included four mice. Mean and SD are shown. ***, P < 0.001. (D) LCs in epidermis of mice. (top) Representative image of LCs. Bars, 50 µm. (bottom) Bar graph shows cumulative result of the number of LCs per 1 mm2 of epidermis. Each group included four mice (mean and SD are shown). **, P < 0.01. (E) Migration of skin DCs to draining LNs. Dorsal shaved skins of WT and S100A9Tg mice previously treated with acetone or TPA were painted with DDAO, and 24 h later DDAO+CD11c+ cells were evaluated in draining LNs by flow cytometry. Each experiment was performed three times. Mean and SD are shown. *, P < 0.05. (F) T cells from OT1 mice were labeled with DDAO fluorescent dye and injected i.v. into TPA-treated WT and S100A9Tg C57BL/6 mice. OVA was applied to the skin 24 h later, and LNs and CD8+CD45.1+ T cell spleens were evaluated by flow cytometry 3 d after the application. A typical example of the CD8+CD45.1+ T cell proliferation is shown on the left, and cumulative results (mean ± SD) of three mice in each group are shown on the right.
Figure 6.
Figure 6.
IMCs recruit CD4+ T cells to the skin. (A) The number of CD4+ T cells in the skin of WT and S100A9Tg FVB/N mice. The number of cells was evaluated by IHC and counted per square millimeter of tissue. Each experiment included five mice. (B) The number of γδ T cells in skin of TPA-treated WT and S100A9Tg C57BL/6 mice. The number of cells was evaluated by IHC and counted per square millimeter of tissue (n = 3). (C) The number of CD4+ T cells in the skin of WT and S100A9KO C57BL/6 mice evaluated by IHC and counted per square millimeter of tissue. Each experiment included five mice. (D) The proportion of CD4+ cells among CD45+ hematopoietic cells in WT and S100A9Tg mice treated with TPA and evaluated by flow cytometry. Six mice per group. (E) Intracellular staining of different cytokines in cells isolated from the skin of WT and S100A9Tg mice treated with TPA. CD4+ cells were gated. Each group included three to six mice. (F) Polarization of naive CD62L+CD4+ T cells by IMCs in vitro. T cells were cultured with BM IMCs from WT and S100A9Tg mice at a 1:1 ratio for 4 d in the presence of CD3/CD28 beads. Cells were then stimulated for 4 h with TPA/ionomycin in the presence of GolgiStop. Intracellular cytokines were evaluated within the population of CD4+ T cells by flow cytometry (n = 5). (A–F) Mean and SD are shown. *, P < 0.05; **, P < 0.01; ***, P < 0.001. (G) Localization of Gr-1+ and CD4+ T cells or γδ T cells in skin of TPA-treated S100A9Tg mice. Immunofluorescent microscopy with the indicated antibodies is performed. Merge staining included DAPI (blue). Typical example of three experiments is shown. Epidermis and dermis are marked with E and D. Please note that to see accumulated CD4+ T cells in the skin, the field had to be moved further down and epidermis was outside the area. Bars, 50 µm.
Figure 7.
Figure 7.
The role of IL-17 in IMC-mediated enhancement of papilloma formation. (A) Papilloma development in CD4-depleted S100A9Tg;Tg.AC bitransgenic mice. CD4 antibody or IgG (control) treatment was performed as indicated on the graph. Mean and SD of papillomas per mouse are shown. Each group included five mice. Two-way ANOVA, P = 0.021. (B) The presence of CD4+ T cells and Gr-1+ IMCs in skin of C57BL/6 S100A9Tg mice treated with TPA and CD4 antibody for 5 wk. Cells were evaluated by IHC (n = 4). (C) The presence of cytokines in tissues of WT and S100A9Tg mice treated with TPA for 6 wk. Cytokines were measured in whole cell lysates using ELISA. **, P < 0.01. (D) The amount of IL-17A in skin of mice described in B measured by ELISA. (B and D) **, P < 0.01 from acetone-treated mice; #, P < 0.05 from TPA only–treated mice (n = 6). (E) Papilloma formation in S100A9Tg C57BL/6 mice was induced by DMBA application, followed by 16 wk of treatment with TPA. Mice were treated with 200 µg of either control IgG or neutralizing IL-17 antibody during the first 12 wk. Each group included five mice. Two-way ANOVA, P < 0.001. (B–E) Mean and SD are shown.
Figure 8.
Figure 8.
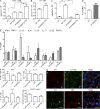
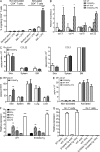
Skin IMCs release CD4+ T cell chemokine CCL4. (A) Chemotaxis of CD4+ T cells isolated from control mice to supernatant from IMCs. IMCs were either stimulated or not with LPS. T cells were stimulated or not with CD3/CD28 antibody. CD4+ T cells were placed in the top chamber and supernatants (30% vol/vol) in the bottom chamber. For control, LPS was added to the medium in the bottom chamber. Mean and SD of cumulative results of six independent experiments are shown. ***, P < 0.001. (B) Quantitative RT-PCR analysis of the expression of ccl3, ccl4, ccl5, and ccl22 in skin of WT or S100A9Tg mice treated with TPA or acetone. Differences in expression of ccl3 and ccl4 were significant. Mean and SD are shown. *, P < 0.01. (C) Amount of CCL22 (left) and CCL3 (right) protein measured by ELISA in lysates of various organs from TPA-treated WT and S100A9Tg mice. Mean and SD from four experiments with three mice per group are shown. Each measurement was performed in duplicate and normalized for total protein. Cumulative results from three experiments are shown. (D) Amount of CCL4 protein measured by ELISA in lysates of various organs from TPA-treated WT and S100A9Tg mice. Mean and SD from four experiments with three mice per group are shown. Each measurement was performed in duplicate normalized for total protein. **, P < 0.01. (E) Amount of CCL4 determined by ELISA in supernatants of IMCs isolated from BM of WT or S100A9Tg mice treated with TPA for 4 wk. Cells were activated with LPS overnight. Measurements were performed twice in duplicates. Mean and SD are shown. (F) Expression of ccl4 in Gr-1+CD11b+ IMCs isolated from BM of naive mice treated for 24 h with the indicated cytokines. The range of most commonly used concentrations was tested. Concentrations shown: 250 ng/ml IFN-γ, 50 ng/ml TNF, 50 ng/ml IL-1β, and 100 ng/ml LPS. Ccl4 expression was measured by quantitative PCR and normalized to β-actin. Mean and SD are shown. *, P < 0.05; **, P < 0.01; ***, P < 0.001 from control (n = 3). (G) Expression of ccl4 in Gr-1+ and Gr-1 cells isolated from skin of WT or S100A9Tg mice treated for 5 wk with TPA (n = 3). Mean and SD are shown.
Figure 9.
Figure 9.
CCL4 is responsible for the recruitment of CD4+ T cells to the skin. (A) Neutralizing CCL4 antibody inhibited migration of activated CD4+ T cells toward supernatant obtained from LPS-stimulated IMCs. Concentrations of CCL4 antibody or IgG are shown in the graph. Two experiments were performed in duplicate. (B) S100A9Tg mice were treated for 4 wk with TPA and either control IgG or neutralizing CCL4 antibody. The number of CD4+ cells in the skin is shown. (C) The amount of IL-17A in the skin of S100A9Tg mice treated with CCL4 antibody. Each group included three mice. (A–C) Mean and SD are shown. *, P < 0.05; **, P < 0.01. (D and E) The number of papillomas formed in Tg.AC (D) and S100A9Tg;Tg.AC (E) mice treated with TPA and control IgG or CCL4 antibody as indicated. Mean and SD are shown. Each group included four mice. P = 0.001 (D) and P < 0.001 (E).

Similar articles

Cited by

References

    1. Arthur J.C., Perez-Chanona E., Mühlbauer M., Tomkovich S., Uronis J.M., Fan T.J., Campbell B.J., Abujamel T., Dogan B., Rogers A.B., et al. . 2012. Intestinal inflammation targets cancer-inducing activity of the microbiota. Science. 338:120–123 10.1126/science.1224820 - DOI - PMC - PubMed
    1. Balkwill F.2009. Tumour necrosis factor and cancer. Nat. Rev. Cancer. 9:361–371 10.1038/nrc2628 - DOI - PubMed
    1. Bierie B., and Moses H.L.. 2010. Transforming growth factor beta (TGF-β) and inflammation in cancer. Cytokine Growth Factor Rev. 21:49–59 10.1016/j.cytogfr.2009.11.008 - DOI - PMC - PubMed
    1. Brandau S., Trellakis S., Bruderek K., Schmaltz D., Steller G., Elian M., Suttmann H., Schenck M., Welling J., Zabel P., and Lang S.. 2011. Myeloid-derived suppressor cells in the peripheral blood of cancer patients contain a subset of immature neutrophils with impaired migratory properties. J. Leukoc. Biol. 89:311–317 10.1189/jlb.0310162 - DOI - PubMed
    1. Bromley S.K., Mempel T.R., and Luster A.D.. 2008. Orchestrating the orchestrators: chemokines in control of T cell traffic. Nat. Immunol. 9:970–980 10.1038/ni.f.213 - DOI - PubMed

Publication types

MeSH terms