

Hepatic acetyl CoA links adipose tissue inflammation to hepatic insulin resistance and type 2 diabetes
- PMID: 25662011
- PMCID: PMC4498261
- DOI: 10.1016/j.cell.2015.01.012
Hepatic acetyl CoA links adipose tissue inflammation to hepatic insulin resistance and type 2 diabetes
Abstract
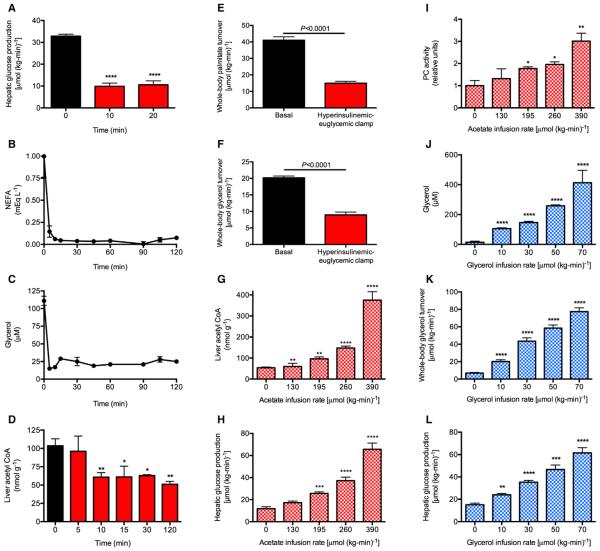
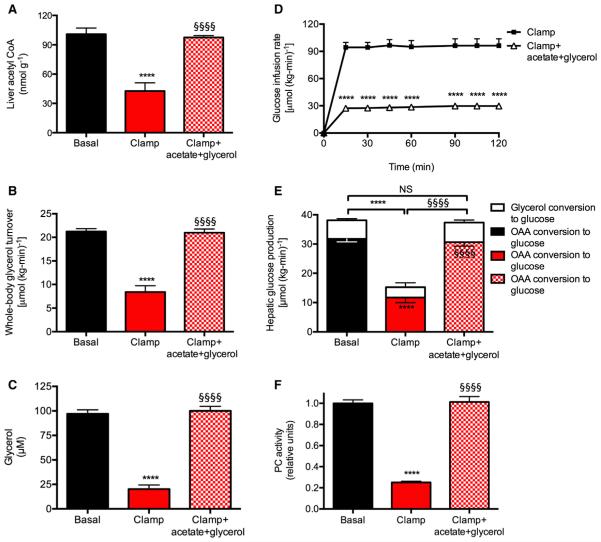
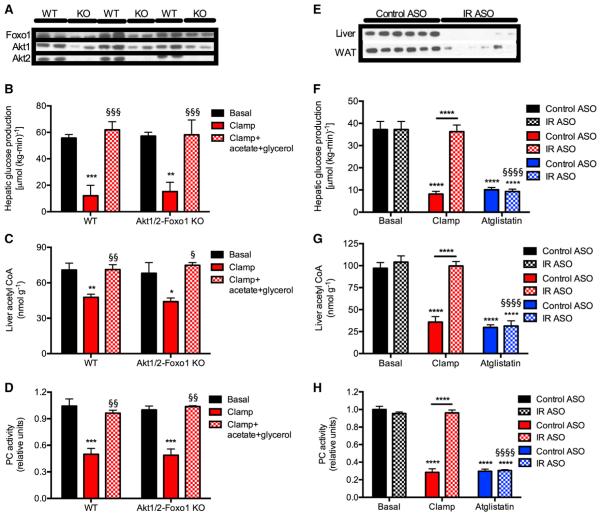
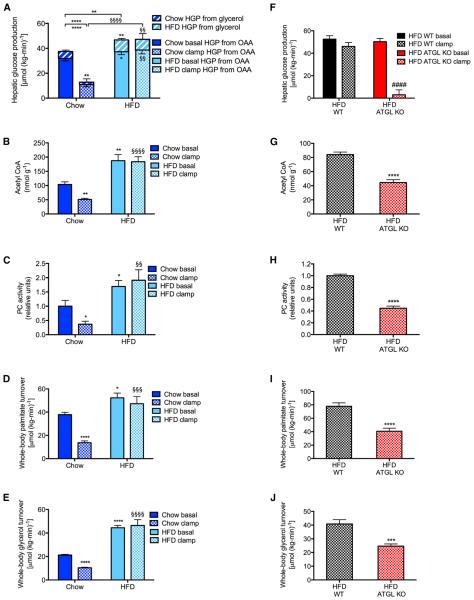
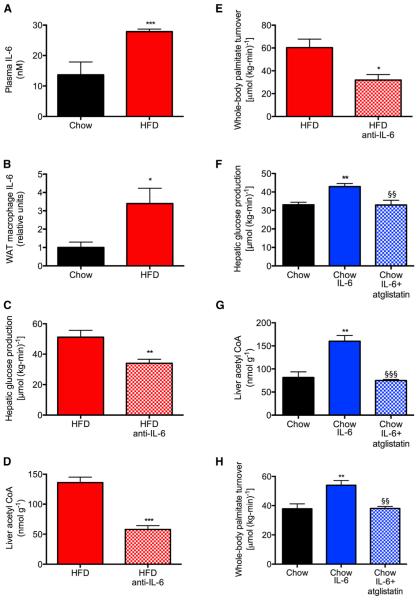
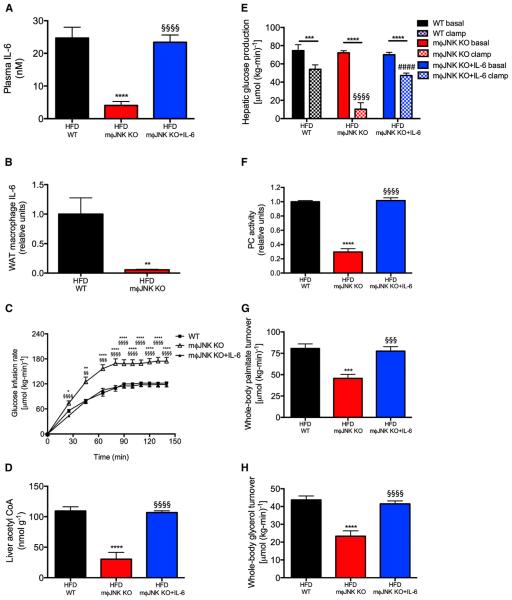
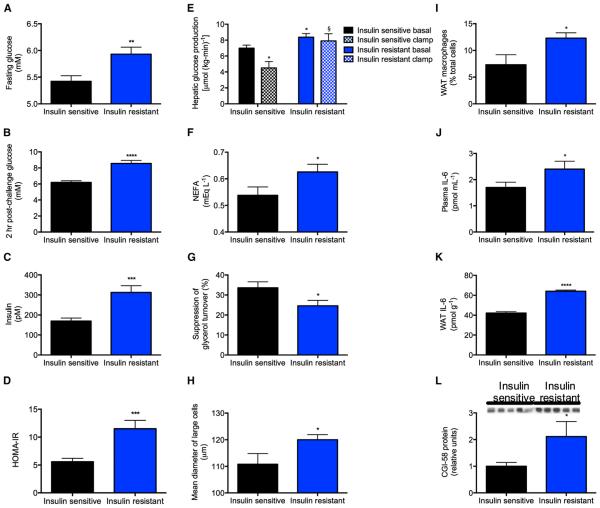
Impaired insulin-mediated suppression of hepatic glucose production (HGP) plays a major role in the pathogenesis of type 2 diabetes (T2D), yet the molecular mechanism by which this occurs remains unknown. Using a novel in vivo metabolomics approach, we show that the major mechanism by which insulin suppresses HGP is through reductions in hepatic acetyl CoA by suppression of lipolysis in white adipose tissue (WAT) leading to reductions in pyruvate carboxylase flux. This mechanism was confirmed in mice and rats with genetic ablation of insulin signaling and mice lacking adipose triglyceride lipase. Insulin's ability to suppress hepatic acetyl CoA, PC activity, and lipolysis was lost in high-fat-fed rats, a phenomenon reversible by IL-6 neutralization and inducible by IL-6 infusion. Taken together, these data identify WAT-derived hepatic acetyl CoA as the main regulator of HGP by insulin and link it to inflammation-induced hepatic insulin resistance associated with obesity and T2D.
Copyright © 2015 Elsevier Inc. All rights reserved.
Figures
Comment in
-
Metabolism. Hepatic insulin resistance--missing link identified.Nat Rev Endocrinol. 2015 Apr;11(4):193. doi: 10.1038/nrendo.2015.17. Epub 2015 Feb 24. Nat Rev Endocrinol. 2015. PMID: 25707785 No abstract available.
Similar articles
-
Mesenteric Fat Lipolysis Mediates Obesity-Associated Hepatic Steatosis and Insulin Resistance.Diabetes. 2016 Jan;65(1):140-8. doi: 10.2337/db15-0941. Epub 2015 Sep 17. Diabetes. 2016. PMID: 26384383
-
The suppression of hepatic glucose production improves metabolism and insulin sensitivity in subcutaneous adipose tissue in mice.Diabetologia. 2016 Dec;59(12):2645-2653. doi: 10.1007/s00125-016-4097-y. Epub 2016 Sep 9. Diabetologia. 2016. PMID: 27631137
-
Mechanisms by which a Very-Low-Calorie Diet Reverses Hyperglycemia in a Rat Model of Type 2 Diabetes.Cell Metab. 2018 Jan 9;27(1):210-217.e3. doi: 10.1016/j.cmet.2017.10.004. Epub 2017 Nov 9. Cell Metab. 2018. PMID: 29129786 Free PMC article.
-
The pathogenesis of insulin resistance: integrating signaling pathways and substrate flux.J Clin Invest. 2016 Jan;126(1):12-22. doi: 10.1172/JCI77812. Epub 2016 Jan 4. J Clin Invest. 2016. PMID: 26727229 Free PMC article. Review.
-
Recent advances in the relationship between obesity, inflammation, and insulin resistance.Eur Cytokine Netw. 2006 Mar;17(1):4-12. Eur Cytokine Netw. 2006. PMID: 16613757 Review.
Cited by
-
Insulin receptor Thr1160 phosphorylation mediates lipid-induced hepatic insulin resistance.J Clin Invest. 2016 Nov 1;126(11):4361-4371. doi: 10.1172/JCI86013. Epub 2016 Oct 17. J Clin Invest. 2016. PMID: 27760050 Free PMC article.
-
Clusterin overexpression in mice exacerbates diabetic phenotypes but suppresses tumor progression in a mouse melanoma model.Aging (Albany NY). 2021 Mar 10;13(5):6485-6505. doi: 10.18632/aging.202788. Epub 2021 Mar 10. Aging (Albany NY). 2021. PMID: 33744871 Free PMC article.
-
Modeling Nonalcoholic Fatty Liver Disease with Human Pluripotent Stem Cell-Derived Immature Hepatocyte-Like Cells Reveals Activation of PLIN2 and Confirms Regulatory Functions of Peroxisome Proliferator-Activated Receptor Alpha.Stem Cells Dev. 2016 Aug 1;25(15):1119-33. doi: 10.1089/scd.2015.0383. Epub 2016 Jul 15. Stem Cells Dev. 2016. PMID: 27308945 Free PMC article.
-
Origin and Function of Stress-Induced IL-6 in Murine Models.Cell. 2020 Jul 23;182(2):372-387.e14. doi: 10.1016/j.cell.2020.05.054. Epub 2020 Jun 30. Cell. 2020. PMID: 32610084 Free PMC article.
-
Role of ACSL5 in fatty acid metabolism.Heliyon. 2023 Jan 31;9(2):e13316. doi: 10.1016/j.heliyon.2023.e13316. eCollection 2023 Feb. Heliyon. 2023. PMID: 36816310 Free PMC article. Review.
References
-
- Barritt GJ, Keech DB, Ling AM. Apparent co-operative effect of acetyl-CoA on sheep kidney pyruvate carboxylase. Biochem. Biophys. Res. Commun. 1966;24:476–481. - PubMed
-
- Beylot M, David F, Brunengraber H. Determination of the 13C-labeling pattern of glutamate by gas chromatography-mass spectrometry. Anal. Biochem. 1993;212:532–536. - PubMed
-
- Cartee GD, Bohn EE. Growth hormone reduces glucose transport but not GLUT-1 or GLUT-4 in adult and old rats. Am. J. Physiol. 1995;268:E902–E909. - PubMed
-
- Cazzulo JJ, Stoppani AO. The regulation of yeast pyruvate carboxylase by acetyl-coenzyme A and L-aspartate. Arch. Biochem. Biophys. 1968;127:563–567. - PubMed
Publication types
MeSH terms
Substances
Grants and funding
- T32 DK101019/DK/NIDDK NIH HHS/United States
- R01 HD028016/HD/NICHD NIH HHS/United States
- R01 DK089098/DK/NIDDK NIH HHS/United States
- K01 DK099402/DK/NIDDK NIH HHS/United States
- R24 DK-085638/DK/NIDDK NIH HHS/United States
- R01 DK93928/DK/NIDDK NIH HHS/United States
- R01 DK-40936/DK/NIDDK NIH HHS/United States
- R01 DK-093959/DK/NIDDK NIH HHS/United States
- R24 DK090963/DK/NIDDK NIH HHS/United States
- R01 DK-056886/DK/NIDDK NIH HHS/United States
- U24 DK059635/DK/NIDDK NIH HHS/United States
- R01 DK056886/DK/NIDDK NIH HHS/United States
- R01 NS087568/NS/NINDS NIH HHS/United States
- P30 DK-45735/DK/NIDDK NIH HHS/United States
- R01 DK040936/DK/NIDDK NIH HHS/United States
- R24 DK-090963/DK/NIDDK NIH HHS/United States
- R24 DK085638/DK/NIDDK NIH HHS/United States
- F32 DK101175/DK/NIDDK NIH HHS/United States
- R01-HD028016/HD/NICHD NIH HHS/United States
- R01 AG023686/AG/NIA NIH HHS/United States
- R01 NS-087568/NS/NINDS NIH HHS/United States
- P30 DK045735/DK/NIDDK NIH HHS/United States
- R01 DK085577/DK/NIDDK NIH HHS/United States
- Howard Hughes Medical Institute/United States
- UL1 TR000142/TR/NCATS NIH HHS/United States
- R01-HD 04787/HD/NICHD NIH HHS/United States
- U24 DK-059635/DK/NIDDK NIH HHS/United States
- R01 DK093959/DK/NIDDK NIH HHS/United States
- T32 DK-101019/DK/NIDDK NIH HHS/United States
- R01 AG-023686/AG/NIA NIH HHS/United States
- P30 DK034989/DK/NIDDK NIH HHS/United States
- R01 DK093928/DK/NIDDK NIH HHS/United States
- UL1 TR-000142/TR/NCATS NIH HHS/United States
LinkOut - more resources
Full Text Sources
Other Literature Sources
Molecular Biology Databases
