. 2015 Apr;25(4):488-503.
doi: 10.1101/gr.185926.114. Epub 2015 Feb 4.

The inactive X chromosome is epigenetically unstable and transcriptionally labile in breast cancer

Affiliations

The inactive X chromosome is epigenetically unstable and transcriptionally labile in breast cancer

Ronan Chaligné et al. Genome Res. 2015 Apr.

Abstract

Disappearance of the Barr body is considered a hallmark of cancer, although whether this corresponds to genetic loss or to epigenetic instability and transcriptional reactivation is unclear. Here we show that breast tumors and cell lines frequently display major epigenetic instability of the inactive X chromosome, with highly abnormal 3D nuclear organization and global perturbations of heterochromatin, including gain of euchromatic marks and aberrant distributions of repressive marks such as H3K27me3 and promoter DNA methylation. Genome-wide profiling of chromatin and transcription reveal modified epigenomic landscapes in cancer cells and a significant degree of aberrant gene activity from the inactive X chromosome, including several genes involved in cancer promotion. We demonstrate that many of these genes are aberrantly reactivated in primary breast tumors, and we further demonstrate that epigenetic instability of the inactive X can lead to perturbed dosage of X-linked factors. Taken together, our study provides the first integrated analysis of the inactive X chromosome in the context of breast cancer and establishes that epigenetic erosion of the inactive X can lead to the disappearance of the Barr body in breast cancer cells. This work offers new insights and opens up the possibility of exploiting the inactive X chromosome as an epigenetic biomarker at the molecular and cytological levels in cancer.


Figures

Figure 1.
Figure 1.
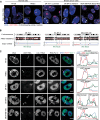
The XIST-coated X-chromosome silent compartment is severely disrupted in breast cancer cell lines. (A) Z-projections of sequential 3D RNA/DNA FISH show examples of XIST RNA coating (red) and X-chromosome territories (white or outlined) in normal (WI-38 and HMEC) and breast cancer cell lines (ZR-75-1, SK-BR-3, and MDA-MB-436). Scale bar, 5 µm. (B) Human SNP Array 6.0 (Affymetrix) genomic analysis (Popova et al. 2009) shows the copy number and allelic imbalance of X-chromosome fragments in breast cancer cell lines. The XIC locus is indicated with a green dotted line. (C) Immuno-RNA FISH using anti-RNA Pol II antibody, XIST/Cot-1 RNA FISH, and DAPI staining show the level of exclusion of RNA Pol II and Cot-1 RNA, as well as the level of chromatin compaction (i.e., Barr body) on XIST RNA domains (arrowheads) in normal and breast cancer cell lines. On the right, line scans (white arrows) show the relative levels of Cot-1 RNA (green), RNA Pol II (black), and DNA density (blue) at the XIST domain (black bar). Scale bar, 5 µm.
Figure 2.
Figure 2.
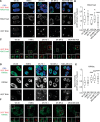
H3K27me3 and H3K9ac profiles associated with XIST-coated X chromosomes are impaired in breast cancer cell lines. (A) Z-projections of 3D immuno-RNA FISH show representative examples of the level of H3K27me3 enrichment (green) on XIST RNA domains (red) in normal (WI-38 and HMEC) and breast cancer cell lines (ZR-75-1, SK-BR-3, and MDA-MB-436). NB: In MDA-MB-436, the highly H3K27me3 enriched bodies visible in each nucleus do not belong to the X chromosome (nor in metaphase [Fig. 3C] or in interphase [Supplemental Fig. S3F]). (B) Boxplot shows the levels of H3K27me3 enrichment on XIST domains relative to the rest of the nucleus. Numbers of analyzed nuclei are shown above the x-axis. For details on quantification method see Supplemental Figure S2A,B. (C) High-resolution immuno-RNA FISH shows representative examples of H3K27me3 enrichment (green) on XIST RNA domains (red) in normal and breast cancer cell lines. Insets for H3K27me3, XIST RNA, and merge are shown below each cell line. (D) Single section of 3D immuno-RNA FISH shows representative examples of the level of H3K9ac depletion (green) on XIST RNA domains (red) in normal and breast cancer cell lines. (E) Boxplot shows the levels of H3K9ac depletion on XIST domains relative to the rest of the nucleus. The numbers of analyzed nuclei are shown above the x-axis. For details on the quantification method, see Supplemental Figure S2A,C. (F) High-resolution immuno-RNA FISH shows representative examples of H3K9ac depletion (green) on XIST RNA domains (red) in normal and breast cancer cell lines. Insets for H3K9ac, XIST RNA, and merge are shown below each cell line. (Boxplots) Upper whisker represents 90%, upper quartile 75%, median 50%, lower quartile 25%, and lower whisker 10% of the data set for each cell line. (***) P < 0.001; (**) P < 0.01; (*) P < 0.05 using the Student's t-test. All data sets are compared with HMEC data set. Scale bar, 5 µm.
Figure 3.
Figure 3.
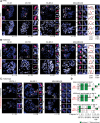
The inactive X chromosome is still epigenetically distinguishable from its active counterpart. (A) Representative examples of immunofluorescence show the status of H4ac (white) depletion/enrichment on X chromosomes (X-paint DNA FISH, red) on metaphase spreads from normal (WI-38) and breast cancer cell lines (ZR-75-1, SK-BR-3, and MDA-MB-436). On the right, MDA-MB-436 cells carry six X-chromosome fragments with a “2-by-2” homology, as assessed by the presence or absence of the NXT2 (white) or XIC loci (green), and line scans show H4ac enrichment variation between these X-fragments and the neighboring autosomal regions. As expected, one X chromosome (Xi) lacks H4ac staining in normal WI-38 cells (and HMEC, not shown). ZR-75-1 and SK-BR-3 cell lines harbor a reduced H4ac staining on one and two X chromosomes, respectively, in agreement with the number of XIST-coated X chromosomes shown in Figure 1A. In MDA-MB-436 cells, homologous X-chromosome fragments (two containing the XIC locus, two containing the NXT2 locus, and two with none of them) display opposite H4ac staining, suggesting that there is still one inactive and one active X chromosome linked to those loci, although fragmented. (B) Representative examples of immunofluorescence show the status of H3K4me2 (white) depletion/enrichment on X chromosomes (X-paint DNA FISH, red) on metaphase spreads from normal and breast cancer cell lines. On the right, line scans show H3K4me2 enrichment variation between the six X-fragments (for details, see A) and the neighboring autosomal regions in MDA-MB-436 cells. In each tumoral cell line, H3K4me2 depletion patterns follow the H4ac profiles found in A. (C) Representative examples of immunofluorescence show the status of H3K27me3 (white) enrichment on X chromosomes (X-paint DNA FISH, red) in metaphase spreads from breast cancer cell lines. ZR-75-1 and SK-BR-3 cell lines harbor an accumulation of H3K27me3 on one and two X chromosomes, respectively, in agreement with the number of XIST-coated X chromosomes shown in A. In MDA-MB-436 cells, H3K27me3 staining was only enriched on the X-chromosome fragment, where the XIC region lies. Indeed, RNA/DNA FISH analysis showed that this X fragment corresponds to the one coated by XIST RNA in interphase cells, which is not the case for the other fragments (Supplemental Fig. S3F). In SK-BR-3 and MDA-MB-436 cell lines, H3K27me3 spreads into the autosomal fragments translocated to the XIC-containing fragment. (D) Schematic view of H4ac, H3K4me2, and H3K27me3 patterns on X-chromosomes in the three tumor cell lines.
Figure 4.
Figure 4.
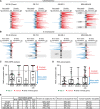
Abnormal reactivation of the inactive X chromosome in breast cancer cell lines. (A,B) RNA SNP6 analysis shows the expression status of an autosomal chromosome, as example Chromosome 2 (A), and the X chromosome (B) in normal (WI-38) and breast cancer cell lines (ZR-75-1, SK-BR-3, and MDA-MB-436). Red bars indicate biallelic expression, and blue bars indicate monoallelic expression. The bar length represents the number of expressed informative SNPs on a 50-SNP sliding window. Gray rectangles correspond to noninformative regions due to loss of heterozygosity (LOH). Two WI-38 subclones (#1 and #28), carrying an inactive X chromosome of opposite parental origin, show clear monoallelic expression from either the maternal or paternal X chromosome confirming the clonality of the subclones (see Supplemental Fig. S4B). Allele-specific PCR analysis also confirmed the clonality of the three breast tumor cell lines (see Supplemental Fig. S4C–E). (C) RNA SNP6 analysis shows levels of X-linked gene allelic expression. X-linked genes known as subject to XCI (Carrel and Willard 2005; Cotton et al. 2013) and/or considered as monoallelically expressed in WI-38 clones (i.e., for each informative gene, <2/3 of the SNPs were observed as biallelically expressed) are shown on the boxplots. (D) RNA-seq analysis shows levels of X-linked gene allelic expression. X-linked shown on the boxplots are known to be subject to XCI (Carrel and Willard 2005; Cotton et al. 2013) and/or are considered as monoallelically expressed in WI-38 clones (i.e., for each informative gene, the allelic expression ratio is <40, i.e., expressed <20% on one of the two alleles). (E) Summary of the informative genes identified by the RNA SNP6 and RNA-seq approaches. Genes “known as subject to XCI” or “known to escape from XCI” refer to previous studies (Carrel and Willard 2005; Cotton et al. 2013). WI-38 data correspond to the two clones.
Figure 5.
Figure 5.
Reactivation of X-linked genes in breast cancer cell lines can lead to an increase of protein amount. (A) Z-projections of 3D RNA FISH show representative examples of TBL1X expression (red) at XIST domains (white) in normal (WI-38 and HMEC) and breast cancer cell lines (ZR-75-1, SK-BR-3, and MDA-MB-436). In ZR-75-1 cells, arrowheads indicate active X chromosomes and the arrow the XIST-coated chromosome. On the right, bar graph shows levels of TBL1X expression from XIST domains, with reactivation in ZR-75-1 cells. (B) Immunostaining shows TBL1X protein (green). The dynamic range (DR) of the brightness and contrast of each image (ImageJ) is indicated below. (C) Boxplot shows the intensity of TBL1X immunostaining for each cell line. The upper whisker represents the maximum value, upper quartile 75%, median 50%, lower quartile 25%, and lower whisker the minimum value of the data set. The number of nuclei analyzed is indicated above the x-axis. (***) P < 0.001 using the Student's t-test. WI-38, ZR-75-1, SK-BR-3, and MDA-MB-436 are compared with HMEC. (D) The inset of two ZR-75-1 nuclei from C shows a combination of TBL1X protein immunofluorescence staining (green) and RNA FISH for TBL1X (red) and XIST (gray). In the left nucleus, where TBL1X is expressed only from the active X chromosome, the IF signal intensity is 1140 a.u., whereas in the right nucleus, where both Xa and Xi TBL1X alleles are expressed, the intensity is as high as 1560 a.u. (E) Boxplot shows the levels of TBL1X signal intensity either in the whole cell population (bulk; left box) or in cells in which TBL1X is expressed only from the active X chromosome (middle box) or when TBL1X is expressed from all X chromosomes (right box). The upper whisker represents the maximum value, upper quartile 75%, median 50%, lower quartile 25%, and lower whisker the minimum value of the data set. Nuclei number analyzed is indicated above the x-axis. (F) Cell sorting of ZR-75-1 cells based on TBL1X signal intensity. An IgG antibody has been used as negative control. (G) Bar graph shows the level of TBL1X expression from the XIST-coated X chromosome by pyrosequencing at SNP rs16985675. Left bar represents the gDNA control, which is in agreement with the allelic imbalance (i.e., one Xi allele and two Xa alleles). Data represent the mean values ±SEM. (***) P < 0.001; (**) P < 0.01; (*) P < 0.05 using the Student's t-test.
Figure 6.
Figure 6.
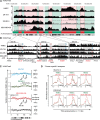
Chromatin landscape of the inactive X chromosome is disrupted in breast cancer cell lines. (A) Scheme of H3K27me3 enrichment (ChIP-seq) across the whole X chromosome. Red and green domains represent H3K27me3 and H3K9me3 enriched regions, respectively, as identified in normal human cells (Chadwick 2007). Regional loss of inactive X is indicated (and depicted by gray region). The two main enriched H3K27me3 domains’ loss in ZR-75-1 and MDA-MB-436 are depicted by the two red dotted rectangles. (B) H3K27me3 enrichment is detailed for three regions of the X chromosome carrying genes subjected (S) or escaping XCI (E). (C) Dot plots show variation of H3K27me3 enrichment along the X chromosome (1-Mb bins) of the three tumoral cell lines and WI-38 relative to HMEC. (D) TSS-centered plots (±1.5 kb) show RNA Pol II and H3K4me3 enrichment for the “cancer-specific” escapees (cf. Supplemental Table S1) of each tumoral cell line (red line) and HMEC (green line). The number of genes analyzed is indicated below each plot.
Figure 7.
Figure 7.
The inactive X chromosome is reactivated in primary breast tumors. (A) Z-projections of 3D RNA FISH show representative examples of expression of HDAC8 (red) and ATRX (green) (left) or TBL1X (red) and MAGEA6 (green) (middle) at XIST domains (gray) in healthy breast tissue and invasive ductal carcinoma (IDC; Luminal A Grade III tumor). On the right, Z-projections of super-resolutive 3D immuno-RNA FISH show representative examples of the level of H3K27me3 enrichment (green) and RNA Pol II depletion (red) on XIST RNA domains (gray) in healthy and tumoral breast tissues. Arrowheads indicate the XIST domains. Quantification of RNA Pol II exclusion and H3K27me3 enrichment at XIST domains have been carried out on images acquired with a confocal spinning-disk microscope. Scale bar, 10 µm. (B) Summary of the XIST domain positive (domains in >10% of the nuclei) and negative tumors among the 41 primary breast tumors studied. (C) Summary of the number of tumors harboring HDAC8, ATRX, or TBL1X expression at XIST domain (assessed by RNA FISH). A gene showing expression within the XIST domain in >5% of the nuclei is considered as reactivated in this tumor. (D) The table recapitulates the number of XIST positive tumors with Xi-linked gene reactivation according to their molecular subtypes: Luminal, HER2 amplified, or Basal-like (BCL).

Similar articles

Cited by

References

    1. Agrelo R, Wutz A. 2010. ConteXt of change—X inactivation and disease. EMBO Mol Med 2: 6–15. - PMC - PubMed
    1. Azoulay S, Laé M, Fréneaux P, Merle S, Al Ghuzlan A, Chnecker C, Rosty C, Klijanienko J, Sigal-Zafrani B, Salmon R, et al.2005. KIT is highly expressed in adenoid cystic carcinoma of the breast, a basal-like carcinoma associated with a favorable outcome. Mod Pathol 18: 1623–1631. - PubMed
    1. Barr ML, Moore KL. 1957. Chromosomes, sex chromatin, and cancer. Proc Can Cancer Conf 2: 3–16. - PubMed
    1. Bennett CL, Christie J, Ramsdell F, Brunkow ME, Ferguson PJ, Whitesell L, Kelly TE, Saulsbury FT, Chance PF, Ochs HD. 2001. The immune dysregulation, polyendocrinopathy, enteropathy, X-linked syndrome (IPEX) is caused by mutations of FOXP3. Nat Genet 27: 20–21. - PubMed
    1. Bernstein BE, Mikkelsen TS, Xie X, Kamal M, Huebert DJ, Cuff J, Fry B, Meissner A, Wernig M, Plath K, et al.2006. A bivalent chromatin structure marks key developmental genes in embryonic stem cells. Cell 125: 315–326. - PubMed

Publication types

MeSH terms

Substances