. 2015 Apr;9(4):834-49.
doi: 10.1016/j.molonc.2014.12.009. Epub 2015 Jan 6.

Honokiol confers immunogenicity by dictating calreticulin exposure, activating ER stress and inhibiting epithelial-to-mesenchymal transition

Affiliations

Honokiol confers immunogenicity by dictating calreticulin exposure, activating ER stress and inhibiting epithelial-to-mesenchymal transition

Shing-Hwa Liu et al. Mol Oncol. 2015 Apr.

Abstract

Peritoneal dissemination is a major clinical obstacle in gastrointestinal cancer therapy, and it accounts for the majority of cancer-related mortality. Calreticulin (CRT) is over-expressed in gastric tumors and has been linked to poor prognosis. In this study, immunohistochemistry studies revealed that the up-regulation of CRT was associated with lymph node and distant metastasis in patients with gastric cancer specimens. CRT was significantly down-regulated in highly metastatic gastric cancer cell lines and metastatic animal by Honokiol-treated. Small RNA interference blocking CRT by siRNA-CRT was translocated to the cells in the early immunogenic response to Honokiol. Honokiol activated endoplasmic reticulum (ER) stress and down-regulated peroxisome proliferator-activated receptor-γ (PPARγ) activity resulting in PPARγ and CRT degradation through calpain-II activity, which could be reversed by siRNA-calpain-II. The Calpain-II/PPARγ/CRT axis and interaction evoked by Honokiol could be blocked by gene silencing or pharmacological agents. Both transforming growth factor (TGF)-β1 and N-methyl-N'-nitro-N-nitrosoguanidine (MNNG) induced cell migration, invasion and reciprocal down-regulation of epithelial marker E-cadherin, which could be abrogated by siRNA-CRT. Moreover, Honokiol significantly suppressed MNNG-induced gastrointestinal tumor growth and over-expression of CRT in mice. Knockdown CRT in gastric cancer cells was found to effectively reduce growth ability and metastasis in vivo. The present study provides insight into the specific biological behavior of CRT in epithelial-to-mesenchymal transition (EMT) and metastasis. Taken together, our results suggest that the therapeutic inhibition of CRT by Honokiol suppresses both gastric tumor growth and peritoneal dissemination by dictating early translocation of CRT in immunogenic cell death, activating ER stress, and blocking EMT.

Keywords: Calreticulin; Carcinogenesis; Endoplasmic reticulum stress; Epithelial-to-mesenchymal transition; Immunogenic cell death.


Figures

Figure 1
Figure 1
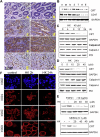
Calreticulin (CRT) expression in gastric tissues and Honokiol trigger early surface exposure of CRT in immunogenic cell death, lately down‐regulation of CRT. (A) a–b. Representative immunohistochemical staining of CRT expression in a human normal gastric mucosa. c–d. Moderately differentiated intestinal type adenocarcinoma. e–f. Poorly differentiated intestinal type adenocarcinoma. g–h. Diffused type adenocarcinoma in mucosa. Scale bar: 10 μm. (B) CRT protein expression differed in various gastric cancer cell lines AGS (A), MKN45 (M), N87 (N), and SCM‐1 (S), mouse tumors mass (T), primary human endothelial cells (HUVECs, H), and primary mouse gastric epithelial cells (E). (C–D) Western blot analyses for CRT in MKN45 cells treated with Honokiol for time–response manner and dose–response manner. (E) Cancer cells were pretreated with Honokiol followed by stimulation with Transforming growth factor‐β1 (TGF‐β1) or N‐methyl‐N′‐nitro‐N‐nitrosoguanidine (MNNG) for 24 h. The results shown are representative of at least four independent experiments. HK, Honokiol. (F) Confocal microscope image for translocation of CRT in MKN45 cells treated with Honokiol for time‐course dependent. Cells were fixed on glass coverslips and labeled with Hoechst 33342 to stain nuclei and Texas red conjugated secondary antibody to anti‐CRT primary antibody (red).
Figure 2
Figure 2
Real‐time monitoring of MKN45 cell phagocytosis by macrophages. Red florescence label positive THP‐1 macrophages (red) and fluorescently labeled MKN45 gastric cancer cells (green) were co‐cultured in the presence of control (A), Honokiol‐treated 2–4 h (B), Honokiol‐treated 16–24 h (C) or silencing CRT (D) and were imaged using video microscopy. (Movies S1, control; S2, Honokiol‐treated 4 h; S3, Honokiol‐treated 18 h and S4, transfection si‐CRT+ Honokiol‐treated 4 h). These time‐lapse movie images showed the dynamic properties of cell–cell interaction as indicated by arrows. Results shown are representative of at least six independent experiments.
Figure 3
Figure 3
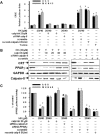
Honokiol‐induced calpain activation, cleavage PPAR‐γ expression regulates CRT production. (A) ER stress activity by ERSE reporter detection. ERSE reporter is designed to measure activity of endoplasmic reticulum (ER) stress signaling. Cancer cells AGS or MKN45 were transfected with ERSE reporter, negative control and positive control (for transfection protocol refers our user material methods). Cancer cells were pre‐incubated with calpain inhibitors, Honokiol, or transfected with siRNA‐Calpain‐II or scramble siRNA for 18 h, and the treated with Honokiol. Tunicamycin (0.1 μg/ml) taken as the positive control. Dual Luciferase assay was performed 36 h after transfection, and promoter activity values are expressed as arbitrary units using a Renilla reporter for internal normalization. Experiments were done in triplicates, and the standard deviation is indicated. (B) Cancer was pre‐treated with calpain inhibitor or transfected with siRNA‐Calpain‐II or scrambled siRNA followed by stimulation with Honokiol for 24 h. Data shown are representative of at least three independent experiments. (C) Cancer cells that were transiently transfected with the PPRE luciferase reporter plasmid and a thymidine kinase promoter‐driven Renilla‐luciferase vector were transiently transfected with siRNA‐Calpain‐II, or siRNA‐PPARγ or control scrambled RNA and treated with Honokiol. The relative activity was measured by luciferase assay as described in the Materials and methods section. Means ± SEM of luciferase activities were calculated from triplicate determinations.
Figure 4
Figure 4
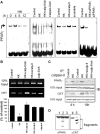
Honokiol regulates PPARγ binds to CRT promoter sequences in vitro. The synthetic dsDNA representing PPARγ‐binding sites in the promoter of CRT gene was examined by electrophoretic mobility shift assay (EMSA) using nuclear extracts of control or Honokiol following stimulation of cells. The unbound excess radiolabeled probe migrated out of the gel and is shown bottom. (A) Cancer cells AGS or MKN45 were treated with Honokiol at various time courses, and nuclear PPARγ DNA binding activity was analyzed by EMSA. Cancer cells were pretreated with calpain inhibitor or transfected with siRNA‐Calpain‐10, scrambled siRNA or siRNA‐PPARγ followed by stimulation with Honokiol for 8 h. The results shown are representative of at least three independent experiments. Arrow indicates specific PPARγ sequences located on CRT promoter DNA binding. The PPARγ DNA binding labeled probe as indicated. All experiments were repeated at least three times. (B) PPARγ binds to the CRT promoter in vivo. ChIP assay was carried out with control, Honokiol or calpain inhibitor. After formaldehyde cross‐linking, the PPARγ‐binding DNA fragments were recovered by immunoprecipitation using PPARγ antibodies. Purified precipitates or input DNA was analyzed by PCR using primers specific for CRT promoters. The cross‐links were reversed and the recovered DNA population was analyzed by PCR with primers designed for detecting CRT. An amplified PCR fragment is visible in the DNA immunoprecipitated with PPARγ antibody in CRT promoters. There is slim visible CRT band in the Honokiol‐treated that could be reverse by Calpain inhibitors. PCR products were subjected to gel electrophoresis and visualized by ethidium bromide staining. 10% aliquot of the pre‐cleared chromatin was taken as input. This experiment has been replicated at least four times with independently assay. All experiments were repeated at least four times. (C) AGS were treated with or without Honokiol as indicated for 10 h. Calpain‐II was immunoprecipitated by anti‐Calpain‐II antibody from cell lysates and the immunoblot was probed with the antibodies for PPARγ or CRT. The results shown are representative of three independent experiments. (D) Proteolysis of PPARγ or CRT in the presence of Calpain‐II enzymatic activity. Purified PPARγ or CRT was digested by the indicated concentrations of recombinant Calpain‐II at 37 °C for 4 h in the presence of 0.5 mM CaCl2. Samples were analyzed by 8% SDS‐PAGE and stained with Coomassie blue. Data shown are from one experiment representative of at least three performed. Lane 1, Purified PPARγ protein; Lane 2, Purified PPARγ protein + recombinant Calpain‐II, 0.1 U/ml; Lane 3, Purified PPARγ protein + Ca2+ 0.5 mM; Lane 4, Purified CRT protein; Lane Purified CRT protein + recombinant Calpain‐II, 0.1 U/ml. The images are representative of at least five independent experiments.
Figure 5
Figure 5
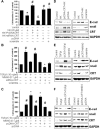
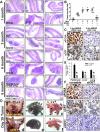
CRT regulates cell invasion and EMT marker characteristics. Cancer was transfected with pcDNA3‐CRT, pcDNA3 for overexpression CRT or siRNA‐Calpain‐II or scrambled siRNA for knockdown CRT protein, followed by stimulation with Honokiol, TGFβ1 or MNNG for 24 h. Cells were evaluated for invasion by Boyden's Transwell assay (A–C) or EMT markers were evaluated by Western blotting (D–F). Silencing CRT inhibited TGFβ1‐ or MNNG‐induced cell invasion (B) and EMT marker E‐cadherin (E‐cad) (E) by CRT constraint in gastric cancer cells. Overexpression of CRT enhanced TGFβ1‐ or MNNG‐induced cell invasion (C) and E‐cad (F) by CRT augmentation in gastric cancer cells. AGS cells were treated with Honokiol for 24 h and whole‐cell lysates were evaluated protein expression as indicated. The results shown are representative of at least five independent experiments. HK, Honokiol.
Figure 6
Figure 6
CRT overexpression in carcinogen MNNG‐induced tumor mass and knockdown CRT inhibits in vivo metastasis of gastric tumors. (A) Carcinogen MNNG‐induced gastrointestinal tract tumor mass formation 1, 3, 6 months individually after intra‐peritoneal injection (5 mg/kg) in administration to BL/6 mice. Another groups for therapy, which sustained for 3 months MNNG‐induced and then derived two groups, then following with injected intraperitoneally with Honokiol (5 mg/kg/twice per week). Three months after Honokiol treatment, mice were sacrificed for tumor mass histology examination of the distribution of RT. (B) Microscopic hematoxylin and eosin staining appearance of the tumor growth of gastrointestinal tract of BL/6 mice after Carcinogen MNNG‐induced tumor cells. At the end of the experiment, gastrointestinal tract along with the primary tumor from the control and Honokiol‐treated mice were carefully excised and counted. The results are presented as a bar graph (n = 5). (C) Immunohistochemistry analysis of tumor mass stained with anti‐PCNA (upper panel), anti‐CRT (lower panel) of tumor burden. (D) Inhibition of gastric cancer growth favored in vivo by siRNA‐CRT and siRNA‐scramble. Transfections of siRNA‐CRT and siRNA‐scramble into MKN45 were performed using Lipofectin. Twenty‐eight days after implantation in abdominal cavity administration to nu/nu mice, the animals were euthanized and their tumors were dissected. Distance of the secondary tumors that migrated from stomach was shown. Image photographic illustration of metastasize to peritoneal tumor, liver and lung. (E) Quantifications of numbers of metastases in different organs (counts/field) were calculated. All data are presented as mean ± SEM (n = 7). (F) Tissues analysis of tumor mass stained with anti‐PCNA (upper panel), anti‐CRT (lower panel) of tumor burden and CD31, an endothelial cell marker.

Similar articles

Cited by

References

    1. Alur, M. , Nguyen, M.M. , Eggener, S.E. , Jiang, F. , Dadras, S.S. , Stern, J. , Kimm, S. , Roehl, K. , Kozlowski, J. , Pins, M. , Michalak, M. , Dhir, R. , Wang, Z. , 2009. Suppressive roles of calreticulin in prostate cancer growth and metastasis. Am. J. Pathol. 175, 882–890. - PMC - PubMed
    1. Chao, M.P. , Majeti, R. , Weissman, I.L. , 2012. Programmed cell removal: a new obstacle in the road to developing cancer. Nat. Rev. Cancer 12, 58–67. - PubMed
    1. Chen, C.N. , Chang, C.C. , Su, T.E. , Hsu, W.M. , Jeng, Y.M. , Ho, M.C. , Hsieh, F.J. , Lee, P.H. , Kuo, M.L. , Lee, H. , Chang, K.J. , 2009. Identification of calreticulin as a prognosis marker and angiogenic regulator in human gastric cancer. Ann. Surg. Oncol. 16, 524–533. - PubMed
    1. Chen, C.N. , Lin, J.J. , Lee, H. , Cheng, Y.M. , Chang, K.J. , Hsieh, F.J. , Lai, H.S. , Chang, C.C. , Lee, P.H. , 2009. Association between color Doppler vascularity index, angiogenesis-related molecules, and clinical outcomes in gastric cancer. J. Surg. Oncol. 99, 402–408. - PubMed
    1. De, C.B. , Berx, G. , 2013. Regulatory networks defining EMT during cancer initiation and progression. Nat. Rev. Cancer 13, 97–110. - PubMed

Publication types

MeSH terms