. 2014 Dec 18;41(6):947-59.
doi: 10.1016/j.immuni.2014.10.020. Epub 2014 Dec 11.

Myeloid-derived suppressor activity is mediated by monocytic lineages maintained by continuous inhibition of extrinsic and intrinsic death pathways

Affiliations

Myeloid-derived suppressor activity is mediated by monocytic lineages maintained by continuous inhibition of extrinsic and intrinsic death pathways

Jessica M Haverkamp et al. Immunity. .

Abstract

Nonresolving inflammation expands a heterogeneous population of myeloid suppressor cells capable of inhibiting T cell function. This heterogeneity has confounded the functional dissection of individual myeloid subpopulations and presents an obstacle for antitumor immunity and immunotherapy. Using genetic manipulation of cell death pathways, we found the monocytic suppressor-cell subset, but not the granulocytic subset, requires continuous c-FLIP expression to prevent caspase-8-dependent, RIPK3-independent cell death. Development of the granulocyte subset requires MCL-1-mediated control of the intrinsic mitochondrial death pathway. Monocytic suppressors tolerate the absence of MCL-1 provided cytokines increase expression of the MCL-1-related protein A1. Monocytic suppressors mediate T cell suppression, whereas their granulocytic counterparts lack suppressive function. The loss of the granulocytic subset via conditional MCL-1 deletion did not alter tumor incidence implicating the monocytic compartment as the functionally immunosuppressive subset in vivo. Thus, death pathway modulation defines the development, survival, and function of myeloid suppressor cells.


Figures

Figure 1
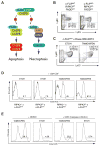
Figure 1. Death pathways can be used to manipulate the population structure and activity of MS
(A–C) BM-generated MS were grown from MCL-1ΔM, C57BL/6, or FLIPΔM mice. (A) Flow cytometry analysis of MS cultures. Numbers indicate the percentage of CD11b+ cells. Cytospins collected from MS cultures. Data are representative of no fewer than 10 independent experiments. (B) Suppressive function of MS was measured using 5 × 10⁵ CFSE-labeled OT-I cells cultured with titrated numbers of MS from each genotype in the presence of SIINFEKL peptide. CFSE dilution in CD8+ cells was evaluated by flow cytometry. Gray shaded histograms show negative control wells cultured without peptide. Plots from 4 independent experiments are shown (n = 2 for each experiment). (C) Representative plots from 2 independent experiments (n = 2 for each experiment) showing CFSE dilution in in CD8+ cells cultured with MCL-1ΔM MS mixed with varying numbers of FLIPΔM MS to a final number of 2 × 10⁵ total MS (top panel) or unmixed control MCL-1ΔM and FLIPΔM MS (bottom panels). (D) Diagram showing how genetics can be used to modulate the composition and suppressive function of MS sub-populations.
Figure 2
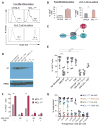
Figure 2. c-FLIP controls Mo-MS viability
(A) Diagram showing the role of c-FLIP in the inhibition of caspase 8 mediated apoptosis and necroptosis. (B) Flow cytometry analysis of BM-MS generated from FLIPWT, RIPK3WT, FADDWT and c-FLIPKO, RIPK3KO, FADDKO triple deficient mice. Numbers indicate the percentage of live cells (n = 3 independent experiments). (C) Flow cytometry analysis of BM-MS from Cflarfl/fl; Rosa-CreERT2 mice treated with 4-OH tamoxifen at d3 of culture. Ethanol at the same final concentration as the 4-OH tamoxifen cultures served as the control. Numbers indicate the percentage of live cells (n = 3 independent experiments). (D) Cflar was exogenously deleted by 4-OH tamoxifen on d5 of culture using BM-MS from Cflarfl/fl; Rosa-CreERT2 mice on a Ripk3+/− or Ripk3−/− background. Control cells received ethanol. On d6 Mo-MS were sorted and cultured with GM-CSF (50 ng/mL) for 24h, after which viability was assessed using V405 staining. (E) Cflar was exogenously deleted by 4-OH tamoxifen in the presence or absence of QVD (20 μM) on d5 of culture using BM-MS from Cflarfl/fl; Rosa-CreERT2 mice. Control cells received ethanol and DMSO. On d6 Mo-MS were sorted and cultured with GM-CSF (50 ng/mL) in the presence or absence of QVD (20 μM) for 24h. Viability was assessed using V405 staining.
Figure 3
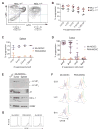
Figure 3. A1 and MCL-1 are needed to maintain the survival of Mo-MS
(A, B) BM-MS were grown from C57BL/6 or MCL-1ΔM mice. The percentage of cell death was measured by V405 staining of control or MCL-1ΔM Mo-MS at d6 of BM-MS culture (top) or after 24 h T cell suppression assay co-culture (bottom). (B) Quantification of V405+ cells from the experiments representative in (A). Data expressed as the mean ± the s.d. and are representative of two independent experiments. Statistical analysis with unpaired t tests was performed; *p ≤ .05, **p≤ .005. (C) Diagram showing the role of A1 and MCL-1 in inhibiting the mitochondrial death pathway. (D) Lysates from C57BL/6 MS cultures were subjected to immunoblotting for A1 following 24 h stimulation with the cytokines shown, all at 50 ng/mL. GRB2 (~ 26 kDa) was used as the loading control. (E) The percentage of non-viable V405+ Mo-MS after stimulation with cytokines (50 ng/mL). Data expressed as the mean ± s.d. and are representative of no less than 3 independent experiments (n = 2 samples for each experiment). Statistical analysis with unpaired t tests was performed; ****p≤ 0.0001. (F) The percentage of non-viable V405+ Mo-MS was evaluated by V405 staining after 24 h stimulation with the indicated cytokines (ng/mL) (n = 3 independent experiments). Quantification of data, expressed as the mean ± s.d. from one independent experiment. Statistical analysis with unpaired t tests was performed; **p ≤ 0.005. (G) Suppressive function of MS was measured using 5 × 10⁵ CFSE-labeled OT-I cells co-cultured with titrated MS in the presence of SIINFEKL peptide. CFSE dilution was evaluated by flow cytometry after 72 h. Data are compiled from 3 independent experiments, and are presented as mean ± s.d.
Figure 4
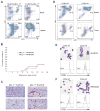
Figure 4. Exogenous regulation of A1 partially rescues c-FLIP loss
(A) BM-MS were grown from C57BL/6 mice. Mo-MS cell lysates were subjected to immunoblotting for the indicated targets following 24 h stimulation with the cytokines shown (ng/mL). GRB2 (~ 26 kDa) was used as the loading control. Protein lysates from FLIPΔM MS served as a specificity control for c-FLIP expression. (B–C) BM-MS cultures from Cflarfl/fl Rosa-Cre-ERT2+ or Cflarfl/fl Rosa-Cre-ERT2- mice were treated with tamoxifen or ethanol as a control on D5 of BM culture. (B) On d6 Mo-MS were sorted and cultured with cytokines for 24 h: GM-CSF (50 ng/mL), TNF (5 ng/mL). Viability was measured by V405 staining. Representative histograms are gated on Ly6C+ cells. (C) Mo-MS were sorted and cultured with the indicated cytokines for 24h. The percentage of non-viable V405+ cells in Mo-MS cultures. Data are expressed as the mean ± s.d. from one independent experiment and are representative of 2 independent experiments (2 mice per group). Statistical analysis with unpaired t tests was performed; ****p≤ 0.0001.
Figure 5
Figure 5. Suppressive function and enhanced expression of anti-apoptotics distinguishes Mo-MDSC at the tumor site
(A) MDSC populations in control and MCL-1ΔM mice bearing EG7 tumors. Contour plots show spleen CD11b+-gated MDSCs. Data are representative of 3 independent experiments (n= 2 mice per group). (B) The suppressive activity of spleen MDSC populations isolated from EG7 tumor-bearing mice. Data are representative of 3 independent experiments. Percent suppression is calculated as described in the methods. Statistical analysis with unpaired t tests was performed; **p ≤ .01. (C–D) MDSCs were isolated from the spleen (C) or tumor (D) of EG7 tumor bearing C57BL/6 mice. Suppressive activity of Mo and PMN-MDSCs was evaluated by CFSE dilution in CD8+ OT-I T cells in the presence of SIINFEKL and titrated MDSCs. (D) Statistical analysis with unpaired t tests was performed; *p <0.01, ****p<0.0001. (E) Protein expression in freshly isolated spleen and tumor Mo-MDSCs from EG7-bearing mice. * indicates a band reactive to anti-c-FLIP antibodies not present in the FLIPΔM negative control that may represent an alternative isoform or processed c-FLIP product. (F) Suppressive function of tumor resident MDSCs using 5 × 10⁵ CFSE-labeled OT-I cells with 4 × 10⁵ (green), 2 × 10⁵ (orange), 1 × 10⁵ (purple) MDSCs with SIINFKEL peptide (gated on CD8+ cells). Cascade plots from 2 experiments are shown (n = 5–8 for each experiment). (G) The ability of tumor resident Mo and PMN-MDSCs to inhibit polyclonal T cell proliferation was evaluated by monitoring CFSE dilution. Representative data from 3 independent experiments are shown (gated on CD8+ cells).
Figure 6
Figure 6. PMN-MDSCs do not influence tumor incidence in vivo and are not immunosuppresive
(A) Representative flow plots of MDSC populations in neuroblastoma+ MCL-1ΔM mice. Contour plots from blood (top) or spleen (bottom) gated on CD11b+ cells. (B) Cumulative tumor incidence measured by ultrasound imaging in MCL-1ΔM (n = 43) or control mice (n = 38) (tumor incidence is ~20–30 % in TH-MYCN+ mice). All mice were generated from Mcl1fl/+; LysM-Cre+; TH-MCYN+ intercrossed housed in the same rack. All mice were screened beginning at 7–8 weeks after birth and screened for 7 consecutive weeks. Tumor incidence between the strains shows no differences (p = 0.1139, Wilcoxon rank sum test). (C) Macrophage density inside neuroblastomas. Paraffin sections were stained with anti-Mac2 (red) to visualize macrophages. (D–F) EG7 tumors were implanted in Ccr2−/− or WT control mice. (D) Phenotypic analysis of MDSC populations in the spleen (top) and tumor (bottom). Plots are gated on CD11b+ cells. (E–F). Mo and PMN-MDSCs were isolated from tumor tissue as shown in (D). Cytospins of sorted MDSC fractions (top panels) and CFSE dilution in CD8+ OT-I cells (bottom panels) cultured in the presence or absence of 2 × 10⁵ Mo and PMN-MDSCs

Similar articles

Cited by

References

    1. Condamine T, Kumar V, Ramachandran IR, Youn JI, Celis E, Finnberg N, El-Deiry WS, Winograd R, Vonderheide RH, English NR, et al. ER stress regulates myeloid-derived suppressor cell fate through TRAIL-R-mediated apoptosis. J Clin Invest. 2014;124:2626–2639. - PMC - PubMed
    1. Dillon CP, Oberst A, Weinlich R, Janke LJ, Kang TB, Ben-Moshe T, Mak TW, Wallach D, Green DR. Survival function of the FADD-CASPASE-8-cFLIP(L) complex. Cell Rep. 2012;1:401–407. - PMC - PubMed
    1. Dolcetti L, Peranzoni E, Bronte V. Measurement of myeloid cell immune suppressive activity. Curr Protoc Immunol. 2010;Chapter 14(Unit 14–17) - PubMed
    1. Dzhagalov I, St John A, He YW. The antiapoptotic protein Mcl-1 is essential for the survival of neutrophils but not macrophages. Blood. 2007;109:1620–1626. - PMC - PubMed
    1. Gabrilovich DI, Bronte V, Chen SH, Colombo MP, Ochoa A, Ostrand-Rosenberg S, Schreiber H. The terminology issue for myeloid-derived suppressor cells. Cancer Res. 2007;67:425. - PMC - PubMed

Publication types

MeSH terms

Substances

Associated data