. 2014 Nov 20;159(5):1212-1226.
doi: 10.1016/j.cell.2014.10.050.

A proteome-scale map of the human interactome network

Thomas Rolland  1 Murat Taşan  2 Benoit Charloteaux  1 Samuel J Pevzner  3 Quan Zhong  4 Nidhi Sahni  1 Song Yi  1 Irma Lemmens  5 Celia Fontanillo  6 Roberto Mosca  7 Atanas Kamburov  1 Susan D Ghiassian  8 Xinping Yang  1 Lila Ghamsari  1 Dawit Balcha  1 Bridget E Begg  1 Pascal Braun  1 Marc Brehme  1 Martin P Broly  1 Anne-Ruxandra Carvunis  1 Dan Convery-Zupan  1 Roser Corominas  9 Jasmin Coulombe-Huntington  10 Elizabeth Dann  1 Matija Dreze  1 Amélie Dricot  1 Changyu Fan  1 Eric Franzosa  10 Fana Gebreab  1 Bryan J Gutierrez  1 Madeleine F Hardy  1 Mike Jin  1 Shuli Kang  9 Ruth Kiros  1 Guan Ning Lin  9 Katja Luck  1 Andrew MacWilliams  1 Jörg Menche  8 Ryan R Murray  1 Alexandre Palagi  1 Matthew M Poulin  1 Xavier Rambout  11 John Rasla  1 Patrick Reichert  1 Viviana Romero  1 Elien Ruyssinck  5 Julie M Sahalie  1 Annemarie Scholz  1 Akash A Shah  1 Amitabh Sharma  8 Yun Shen  1 Kerstin Spirohn  1 Stanley Tam  1 Alexander O Tejeda  1 Shelly A Wanamaker  1 Jean-Claude Twizere  11 Kerwin Vega  1 Jennifer Walsh  1 Michael E Cusick  1 Yu Xia  10 Albert-László Barabási  12 Lilia M Iakoucheva  9 Patrick Aloy  13 Javier De Las Rivas  6 Jan Tavernier  5 Michael A Calderwood  1 David E Hill  1 Tong Hao  1 Frederick P Roth  14 Marc Vidal  15
Affiliations

A proteome-scale map of the human interactome network

Thomas Rolland et al. Cell. .

Abstract

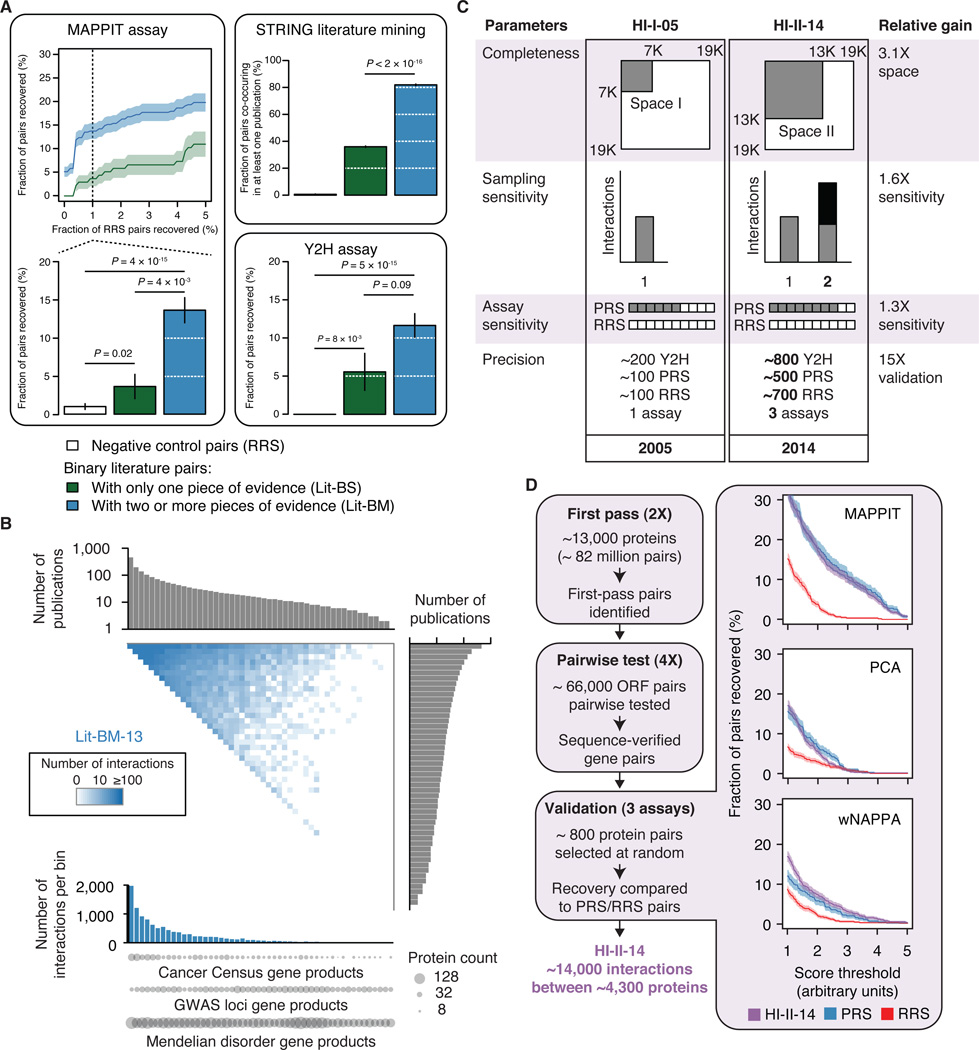
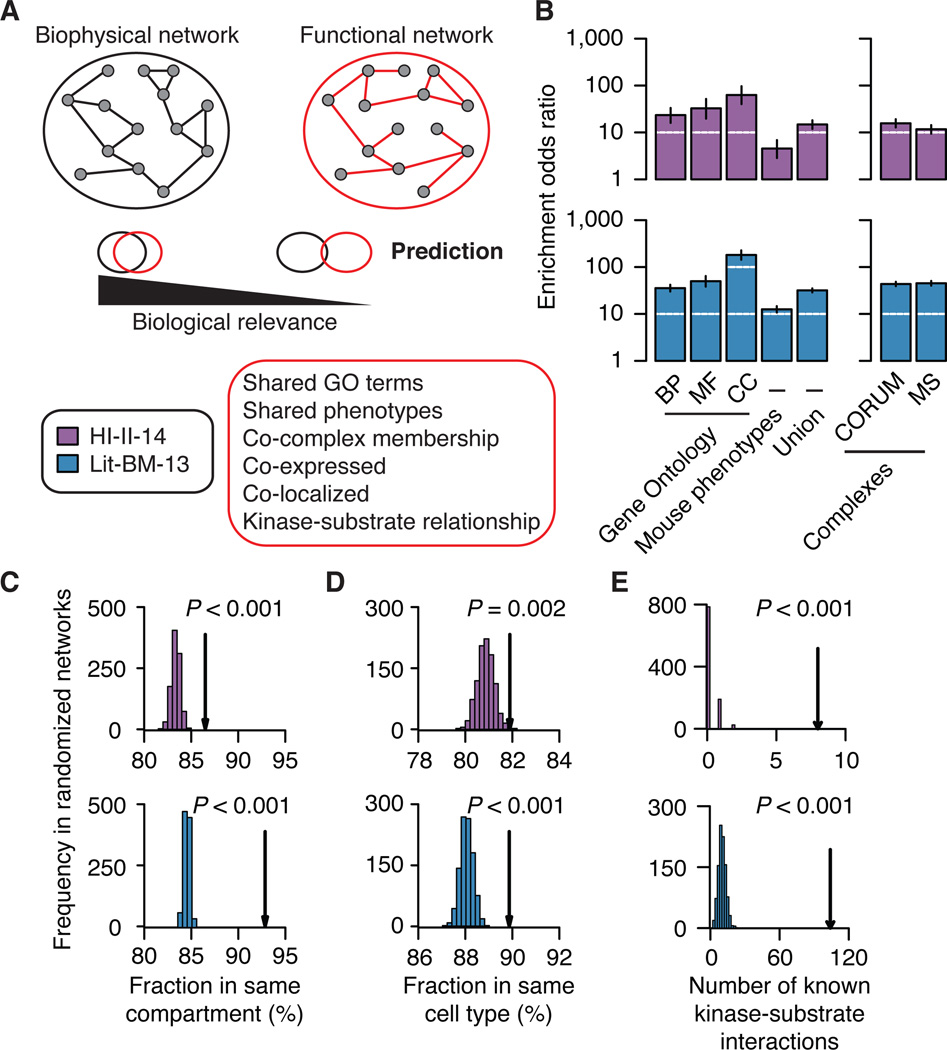
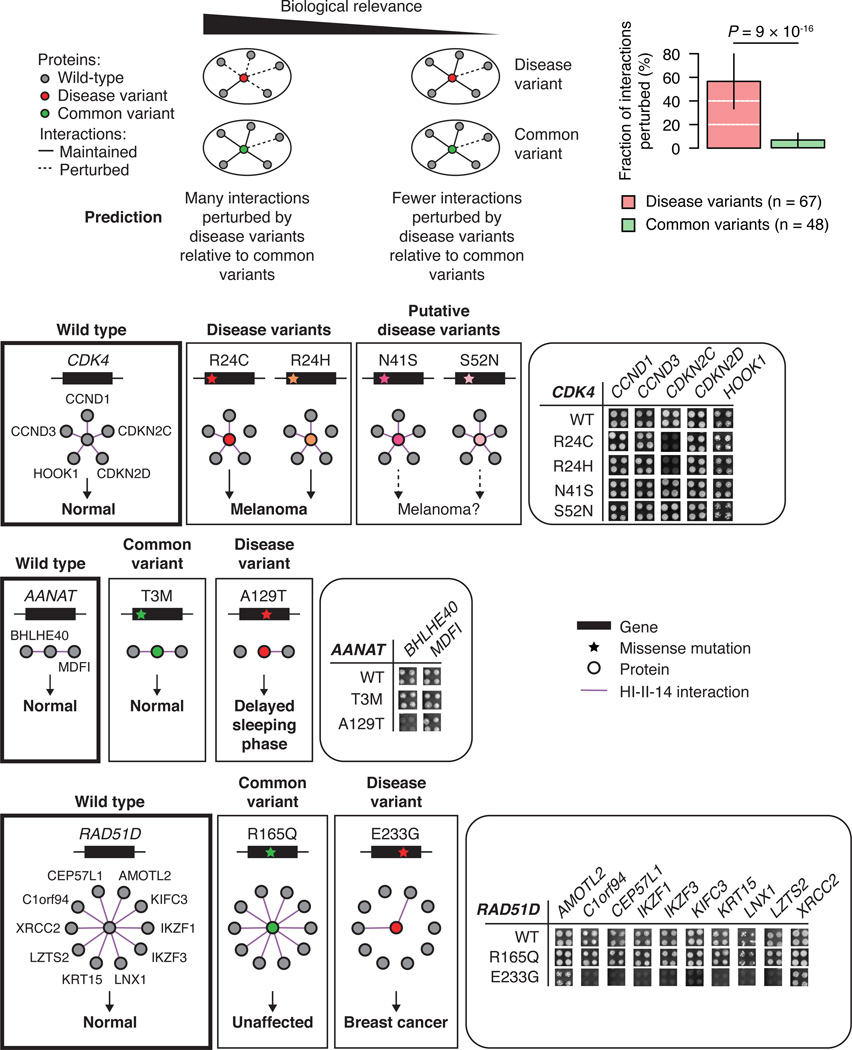
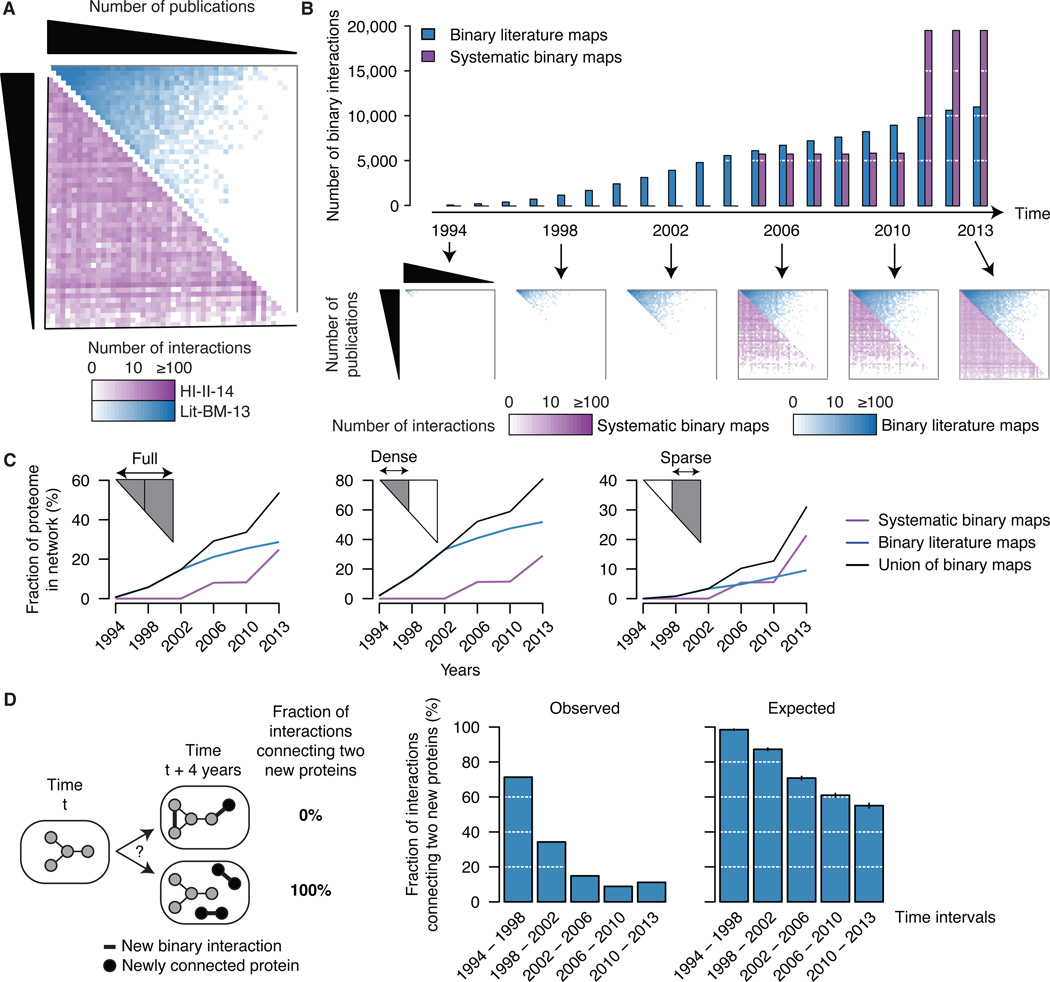
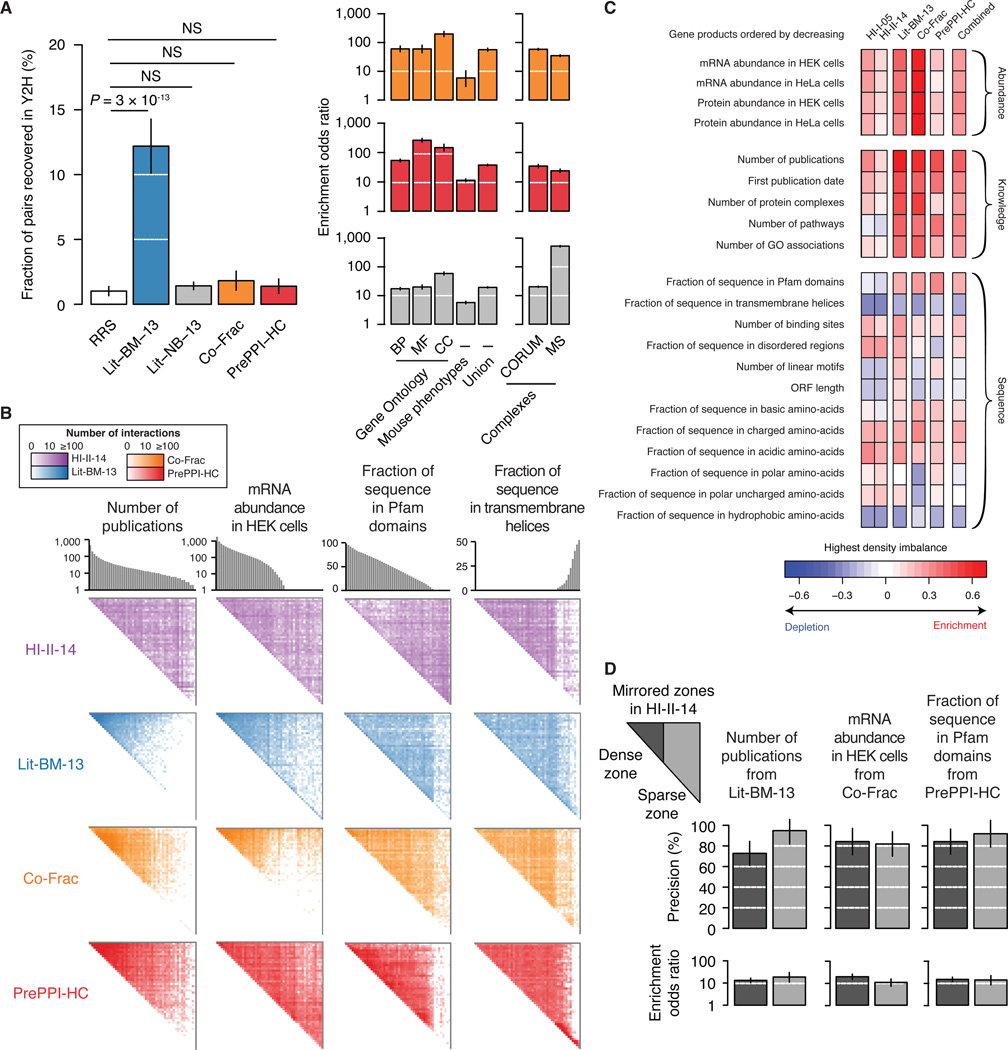
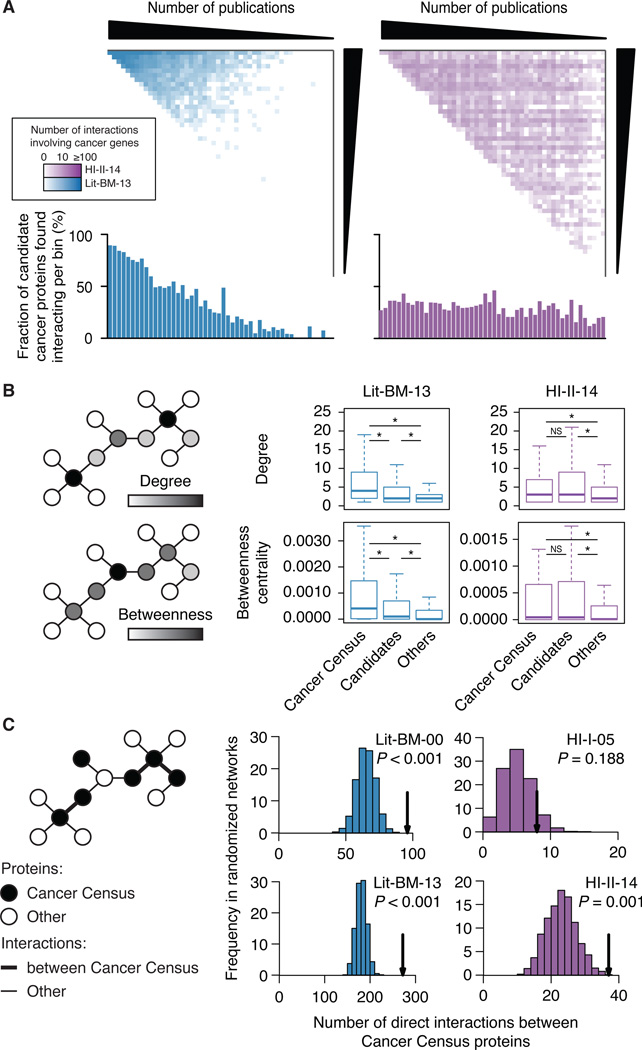
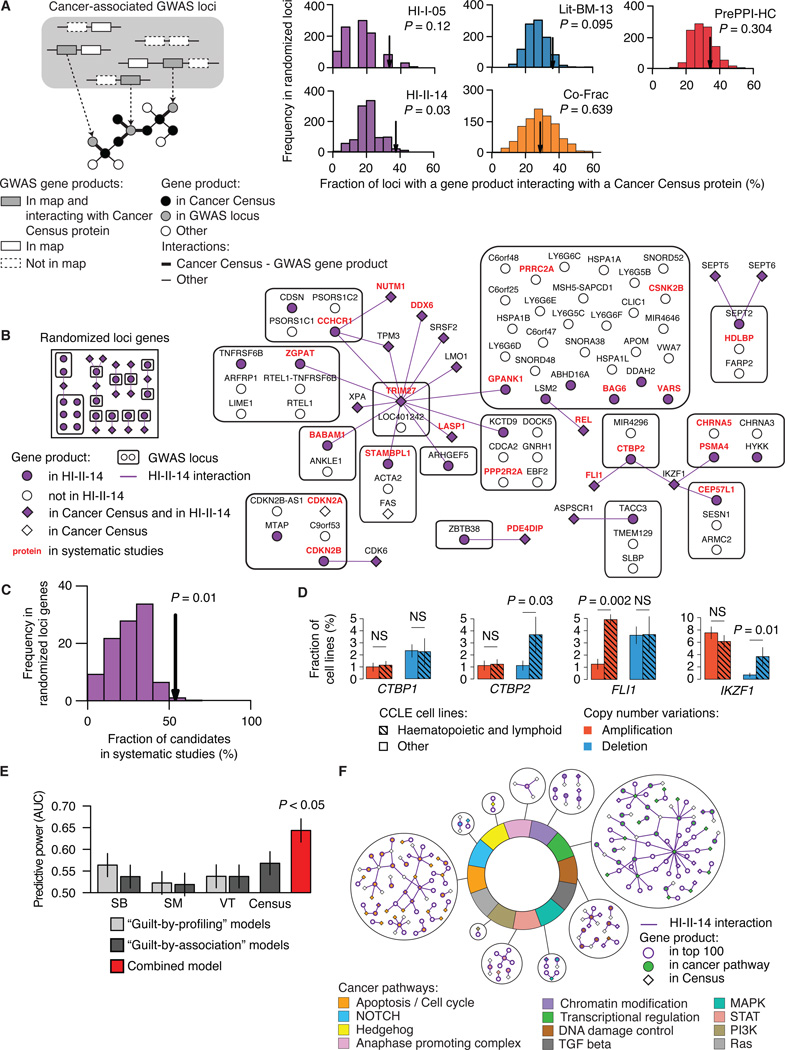
Just as reference genome sequences revolutionized human genetics, reference maps of interactome networks will be critical to fully understand genotype-phenotype relationships. Here, we describe a systematic map of ?14,000 high-quality human binary protein-protein interactions. At equal quality, this map is ?30% larger than what is available from small-scale studies published in the literature in the last few decades. While currently available information is highly biased and only covers a relatively small portion of the proteome, our systematic map appears strikingly more homogeneous, revealing a "broader" human interactome network than currently appreciated. The map also uncovers significant interconnectivity between known and candidate cancer gene products, providing unbiased evidence for an expanded functional cancer landscape, while demonstrating how high-quality interactome models will help "connect the dots" of the genomic revolution.


Figures

Figure 1
Figure 1. Vast uncharted interactome zone in literature and generation of a systematic binary dataset
(A) Validation of binary literature pairs extracted from public databases (Bader et al., 2003; Berman et al., 2000; Chatr-aryamontri et al., 2013; Kerrien et al., 2012; Licata et al., 2012; Prasad et al., 2009; Salwinski et al., 2004). Fraction of pairs recovered by MAPPIT at increasing RRS recovery rates (top left) and at 1% RRS recovery rate (bottom left), found to co-occur in the literature as reported in the STRING database (upper right), and recovered by Y2H (lower right). Shading and error bars indicate standard error of the proportion. P values, two-sided Fisher’s exact tests. For n values, see Table S6. (B) Adjacency matrix showing Lit-BM-13 interactions, with proteins in bins of ~350 and ordered by number of publications along both axes. Upper and right histograms show the median number of publications per bin. The color intensity of each square reflects the total number of interactions between proteins for the corresponding bins. Total number of interactions per bin (lower histogram). Number of gene products from GWAS loci (Hindorff et al., 2009), Mendelian disease genes (Hamosh et al., 2005) and Sanger Cancer Gene Census (Cancer Census) (Futreal et al., 2004) genes per bin (circles). (C) Improvements from first-generation to second-generation interactome mapping based on an empirically-controlled framework (Venkatesan et al., 2009). Completeness: fraction of all pairwise protein combinations tested; Assay sensitivity: fraction of all true biophysical interactions that are identifiable by a given assay; Sampling sensitivity, fraction of identifiable interactions that are detected in the experiment; Precision: fraction of reported pairs that are true positives. (D) Experimental pipeline for identifying high-quality binary protein-protein interactions (left). ORF: Open Reading Frame. Fraction of HI-II-14, PRS and RRS pairs (right) recovered by MAPPIT, PCA and wNAPPA at increasing assay stringency. Shading indicates standard error of the proportion. P > 0.05 for all assays when comparing PRS and HI-II-14 at 1% RRS, twosided Fisher’s exact tests. For n values, see Table S6. See also Figures S1 and S2 and Tables S1 and S2.
Figure 2
Figure 2. Overall biological significance
(A) Schematic of the method to assess biological relevance of binary maps. (B) Enrichment of binary interactome maps for functional relationships (left) and co-complex memberships (right). Error bars indicate 95% confidence intervals. BP: Biological process, MF: Molecular function, CC: Cellular component. Mouse phenotypes: Shared phenotypes in mouse models by orthology mapping. MS: Mass-spectrometry based map. Enrichments: P ≤ 0.05 for all annotations and maps, two-sided Fisher’s exact tests. For n values, see Table S6. (C) and (D) Fraction of binary interactions between proteins localized in a common cellular compartment and proteins co-present in at least one cell type (arrows) compared to those in 1,000 degree-controlled randomized networks. Empirical P values. For n values, see Table S6. (E) Number of known kinase-substrate interactions found in binary maps (arrows) compared to those in 1,000 randomized networks. Empirical P values are shown. See also Figure S3.
Figure 3
Figure 3. Perturbations of protein interactions by disease and common variants
Fraction of interactions of the wild-type gene product lost by mutants bearing the disease-associated or common variants (top right, error bars indicate standard error of the proportion). P value, two-sided Fisher’s exact test. Comparison of interaction profile of wild-type CDK4, AANAT, and RAD51D to the interaction profiles of mutant bearing disease or common variants (bottom). Yeast growth phenotypes on SC-Leu-Trp-His+3AT media in quadruplicate experiments are shown. See also Figure S3 and Table S3.
Figure 4
Figure 4. A “broader” interactome
(A) Adjacency matrices showing Lit-BM-13 (blue) and HI-II-14 (purple) interactions, with proteins in bins of ~350 and ordered by number of publications along both axes. The color intensity of each square reflects the total number of interactions for the corresponding bins. (B) Total number of binary interactions in literature and systematic interactome maps over the past 20 years (top), with years reflecting either date of public release of systematic binary datasets or date of publication that resulted in inclusion of interactions in Lit-BM-13. Adjacency matrices (bottom) as in Figure 4A. (C) Fraction of the human proteome present in binary interactome maps at selected time points since 1994, considering the full interactome space (left) or only dense (middle) and sparse (right) zones of Lit-BM-13 with respect to number of publications. (D) Fraction of new interactions connecting two proteins that were both absent from the map at the previous time point (four years interval; middle) compared to 1,000 randomized networks (right).
Figure 5
Figure 5. Comparison of interaction mapping approaches
(A) Evaluation of the quality of Co-Frac, PrePPI-HC and pairs from small-scale experiments in the literature with no binary evidence (Lit-NB-13). Fraction of pairs recovered by Y2H as compared to pairs from Lit-BM-13 and pairs of randomly selected proteins (RRS) (left). Enrichment in functional interactions and co-complex memberships (right). Legend as in Figure 2B. For n values, see Table S6. (B) Adjacency matrices for HI-II-14, Lit-BM-13, Co-Frac and PrePPI-HC maps, with proteins per bins of ~350 and ordered by number of publications, mRNA abundance in HEK cells, fraction of protein sequence covered by Pfam domains, or fraction of protein sequence in transmembrane helices. Figure legend as in Figure 1B. (C) Highest interaction density imbalances (observed minus expected) are shown in the four maps, the union of all four maps, and our previous binary map (HI-I-05) for 21 protein properties. (D) Precision at 1% RRS recovery in the MAPPIT assay (top, error bars indicate standard error of the proportion) and functional enrichment (bottom, union of Gene Ontology and mouse phenotypes based annotations, error bars indicate 95% confidence intervals) of HI-II-14 pairs found in dense and sparse zones mirrored from Lit-BM-13, Co-Frac and PrePPI-HC. P > 0.05 for all pairwise comparisons of dense and sparse zones, two-sided Fisher’s exact tests. For n values, see Table S6. See also Figure S4 and Table S4.
Figure 6
Figure 6. Network properties of cancer gene products
(A) Adjacency matrices for Lit-BM-13 and HI-II-14 only showing interactions involving the product of a Cancer Census (Futreal et al., 2004) or of a candidate cancer gene. Figure legend as in Figure 1B. Lower histograms show for each bin, the fraction of cancer candidates having at least one interaction. (B) Distribution of the number of interactions (degree) and normalized number of shortest paths between proteins (betweenness centrality) for products of Cancer Census and of candidate cancer genes in Lit-BM-13 and in HI-II-14 maps as compared to other proteins (right; * for P < 0.05, NS for P > 0.05, two-sided Wilcoxon rank sum tests). For n values, see Table S6. (C) Number of interactions between products of Cancer Census genes (arrows) in HI-I-05, HI-II-14, Lit-BM as of 2000 (Lit-BM-00) and as of 2013 (Lit-BM-13), as compared to 1,000 degree-controlled randomized networks. Empirical P values. For n values, see Table S6.
Figure 7
Figure 7. Interactome network and cancer landscape
(A) Fraction of cancer-related GWAS loci containing at least one gene encoding a protein that interacts with the product of a Cancer Census gene in HI-I-05, HI-II-14, Lit-BM-13, Co-Frac and PrePPI-HC (arrows) as compared to randomly selected loci genes. GWAS loci already containing a Cancer Census gene are excluded. Empirical P values. For n values, see Table S6. (B) Network representing products of genes in cancer-associated GWAS loci and their interactions with Cancer Census proteins in HI-II-14 (right), and a representative example of the network obtained for randomized loci genes (left). (C) Fraction of GWAS loci gene products interacting with a Cancer Census protein also identified in systematic genomic and functional genomic studies (arrow) as compared to the fraction obtained for randomized loci genes (bottom right). Empirical P value. (D) CTBP2 and IKZF1 are deleted in significantly more haematopoietic and lymphoid cancer cell lines than in other cancer cell lines. CCLE, Cancer Cell Line Encyclopedia. Each barplot compares the fraction of cell lines from the 163 haematopoietic and lymphoid (hatched bars) or 717 other (empty bars) cell types where CTBP1, CTBP2, FLI1 or IKZF1 were found amplified (red) or deleted (blue). P values, two-sided Fisher’s exact tests (NS for P > 0.05). (E) Predictive power of guilt-by-profiling and guilt-by-association models compared to the combined model (Figure S6; see Extended Experimental Procedures, Section 11). AUC: Area under the curve in Figure S6C. P value, two-sided Wilcoxon rank sum test. SB, Sleeping Beauty transposon-based mouse cancer screen; SM, Somatic mutation screen in cancer tissues; VT, Virus targets. (F) Binary interactions from HI-II-14 involving the top candidates and Cancer Census gene products in the twelve pathways associated to cancer development and progression. See also Figures S5, S6 and S7 and Table S5.

Comment in

Similar articles

  • A reference map of the human binary protein interactome.
    Luck K, Kim DK, Lambourne L, Spirohn K, Begg BE, Bian W, Brignall R, Cafarelli T, Campos-Laborie FJ, Charloteaux B, Choi D, Coté AG, Daley M, Deimling S, Desbuleux A, Dricot A, Gebbia M, Hardy MF, Kishore N, Knapp JJ, Kovács IA, Lemmens I, Mee MW, Mellor JC, Pollis C, Pons C, Richardson AD, Schlabach S, Teeking B, Yadav A, Babor M, Balcha D, Basha O, Bowman-Colin C, Chin SF, Choi SG, Colabella C, Coppin G, D'Amata C, De Ridder D, De Rouck S, Duran-Frigola M, Ennajdaoui H, Goebels F, Goehring L, Gopal A, Haddad G, Hatchi E, Helmy M, Jacob Y, Kassa Y, Landini S, Li R, van Lieshout N, MacWilliams A, Markey D, Paulson JN, Rangarajan S, Rasla J, Rayhan A, Rolland T, San-Miguel A, Shen Y, Sheykhkarimli D, Sheynkman GM, Simonovsky E, Taşan M, Tejeda A, Tropepe V, Twizere JC, Wang Y, Weatheritt RJ, Weile J, Xia Y, Yang X, Yeger-Lotem E, Zhong Q, Aloy P, Bader GD, De Las Rivas J, Gaudet S, Hao T, Rak J, Tavernier J, Hill DE, Vidal M, Roth FP, Calderwood MA. Luck K, et al. Nature. 2020 Apr;580(7803):402-408. doi: 10.1038/s41586-020-2188-x. Epub 2020 Apr 8. Nature. 2020. PMID: 32296183 Free PMC article.
  • Towards a proteome-scale map of the human protein-protein interaction network.
    Rual JF, Venkatesan K, Hao T, Hirozane-Kishikawa T, Dricot A, Li N, Berriz GF, Gibbons FD, Dreze M, Ayivi-Guedehoussou N, Klitgord N, Simon C, Boxem M, Milstein S, Rosenberg J, Goldberg DS, Zhang LV, Wong SL, Franklin G, Li S, Albala JS, Lim J, Fraughton C, Llamosas E, Cevik S, Bex C, Lamesch P, Sikorski RS, Vandenhaute J, Zoghbi HY, Smolyar A, Bosak S, Sequerra R, Doucette-Stamm L, Cusick ME, Hill DE, Roth FP, Vidal M. Rual JF, et al. Nature. 2005 Oct 20;437(7062):1173-8. doi: 10.1038/nature04209. Epub 2005 Sep 28. Nature. 2005. PMID: 16189514
  • Proteome-Scale Human Interactomics.
    Luck K, Sheynkman GM, Zhang I, Vidal M. Luck K, et al. Trends Biochem Sci. 2017 May;42(5):342-354. doi: 10.1016/j.tibs.2017.02.006. Epub 2017 Mar 8. Trends Biochem Sci. 2017. PMID: 28284537 Free PMC article. Review.
  • A Proteome-wide Fission Yeast Interactome Reveals Network Evolution Principles from Yeasts to Human.
    Vo TV, Das J, Meyer MJ, Cordero NA, Akturk N, Wei X, Fair BJ, Degatano AG, Fragoza R, Liu LG, Matsuyama A, Trickey M, Horibata S, Grimson A, Yamano H, Yoshida M, Roth FP, Pleiss JA, Xia Y, Yu H. Vo TV, et al. Cell. 2016 Jan 14;164(1-2):310-323. doi: 10.1016/j.cell.2015.11.037. Cell. 2016. PMID: 26771498 Free PMC article.
  • Proteome-wide prediction of protein-protein interactions from high-throughput data.
    Liu ZP, Chen L. Liu ZP, et al. Protein Cell. 2012 Jul;3(7):508-20. doi: 10.1007/s13238-012-2945-1. Epub 2012 Jun 22. Protein Cell. 2012. PMID: 22729399 Free PMC article. Review.

Cited by

References

    1. 1000 Genomes Project Consortium. An integrated map of genetic variation from 1,092 human genomes. Nature. 2012;491:56–65. - PMC - PubMed
    1. Bader GD, Betel D, Hogue CW. BIND: the Biomolecular Interaction Network Database. Nucleic Acids Res. 2003;31:248–250. - PMC - PubMed
    1. Barabási A-L, Gulbahce N, Loscalzo J. Network medicine: a network-based approach to human disease. Nat. Rev. Genet. 2011;12:56–68. - PMC - PubMed
    1. Barretina J, Caponigro G, Stransky N, Venkatesan K, Margolin AA, Kim S, Wilson CJ, Lehar J, Kryukov GV, Sonkin D, et al. The Cancer Cell Line Encyclopedia enables predictive modelling of anticancer drug sensitivity. Nature. 2012;483:603–607. - PMC - PubMed
    1. Berman HM, Westbrook J, Feng Z, Gilliland G, Bhat TN, Weissig H, Shindyalov IN, Bourne PE. The Protein Data Bank. Nucleic Acids Res. 2000;28:235–242. - PMC - PubMed

Publication types