

Landscape of DNA methylation on the X chromosome reflects CpG density, functional chromatin state and X-chromosome inactivation
- PMID: 25381334
- PMCID: PMC4381753
- DOI: 10.1093/hmg/ddu564
Landscape of DNA methylation on the X chromosome reflects CpG density, functional chromatin state and X-chromosome inactivation
Abstract
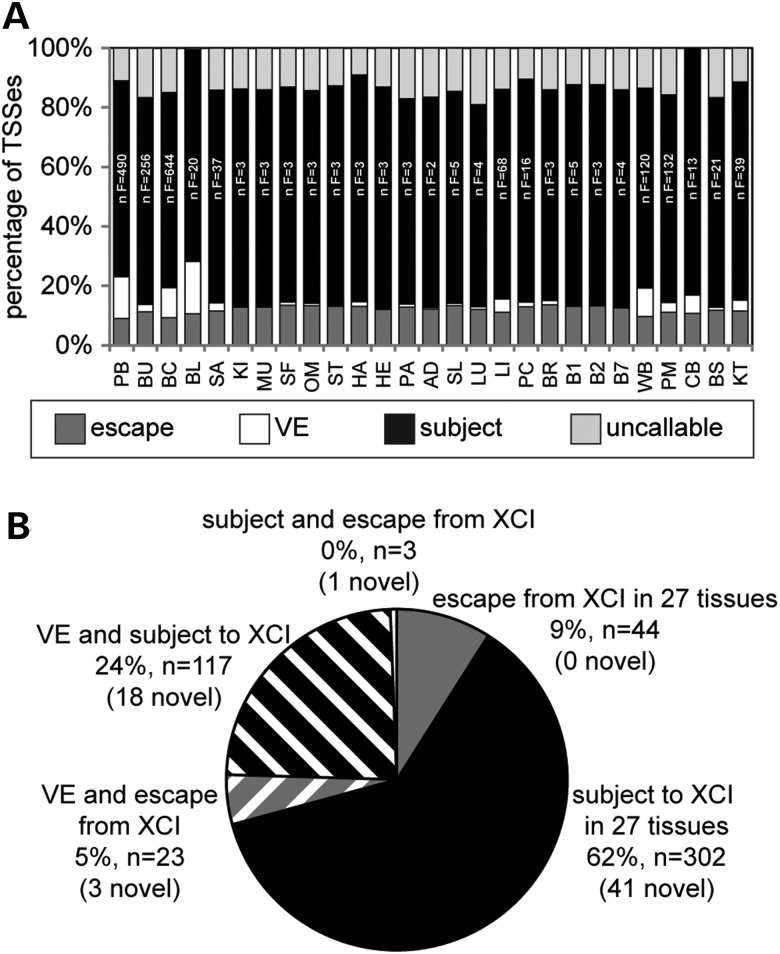
X-chromosome inactivation (XCI) achieves dosage compensation between males and females through the silencing of the majority of genes on one of the female X chromosomes. Thus, the female X chromosomes provide a unique opportunity to study euchromatin and heterochromatin of allelic regions within the same nuclear environment. We examined the interplay of DNA methylation (DNAm) with CpG density, transcriptional activity and chromatin state at genes on the X chromosome using over 1800 female samples analysed with the Illumina Infinium Human Methylation450 BeadChip. DNAm was used to predict an inactivation status for 63 novel transcription start sites (TSSs) across 27 tissues. There was high concordance of inactivation status across tissues, with 62% of TSSs subject to XCI in all 27 tissues examined, whereas 9% escaped from XCI in all tissues, and the remainder showed variable escape from XCI between females in subsets of tissues. Inter-female and twin data supported a model of predominately cis-acting influences on inactivation status. The level of expression from the inactive X relative to the active X correlated with the amount of female promoter DNAm to a threshold of ∼30%, beyond which genes were consistently subject to inactivation. The inactive X showed lower DNAm than the active X at intragenic and intergenic regions for genes subject to XCI, but not at genes that escape from inactivation. Our categorization of genes that escape from X inactivation provides candidates for sex-specific differences in disease.
© The Author 2014. Published by Oxford University Press.
Figures


Similar articles
-
Chromosome-wide DNA methylation analysis predicts human tissue-specific X inactivation.Hum Genet. 2011 Aug;130(2):187-201. doi: 10.1007/s00439-011-1007-8. Epub 2011 May 20. Hum Genet. 2011. PMID: 21597963 Free PMC article.
-
DNA methylation profiles of human active and inactive X chromosomes.Genome Res. 2011 Oct;21(10):1592-600. doi: 10.1101/gr.112680.110. Epub 2011 Aug 23. Genome Res. 2011. PMID: 21862626 Free PMC article.
-
Contribution of genetic and epigenetic changes to escape from X-chromosome inactivation.Epigenetics Chromatin. 2021 Jun 29;14(1):30. doi: 10.1186/s13072-021-00404-9. Epigenetics Chromatin. 2021. PMID: 34187555 Free PMC article.
-
Escape Artists of the X Chromosome.Trends Genet. 2016 Jun;32(6):348-359. doi: 10.1016/j.tig.2016.03.007. Epub 2016 Apr 18. Trends Genet. 2016. PMID: 27103486 Review.
-
Detection of skewed X-chromosome inactivation in Fragile X syndrome and X chromosome aneuploidy using quantitative melt analysis.Expert Rev Mol Med. 2015 Jul 1;17:e13. doi: 10.1017/erm.2015.11. Expert Rev Mol Med. 2015. PMID: 26132880 Free PMC article. Review.
Cited by
-
Regional epigenetic differentiation of the Z Chromosome between sexes in a female heterogametic system.Genome Res. 2019 Oct;29(10):1673-1684. doi: 10.1101/gr.248641.119. Epub 2019 Sep 23. Genome Res. 2019. PMID: 31548356 Free PMC article.
-
The Methylome of Vertebrate Sex Chromosomes.Genes (Basel). 2018 May 1;9(5):230. doi: 10.3390/genes9050230. Genes (Basel). 2018. PMID: 29723955 Free PMC article. Review.
-
Landscape of genome-wide age-related DNA methylation in breast tissue.Oncotarget. 2017 Nov 29;8(70):114648-114662. doi: 10.18632/oncotarget.22754. eCollection 2017 Dec 29. Oncotarget. 2017. PMID: 29383109 Free PMC article.
-
DNA methylation biomarkers for nasopharyngeal carcinoma.PLoS One. 2020 Apr 9;15(4):e0230524. doi: 10.1371/journal.pone.0230524. eCollection 2020. PLoS One. 2020. PMID: 32271791 Free PMC article.
-
Sex differences in the response to oxidative and proteolytic stress.Redox Biol. 2020 Apr;31:101488. doi: 10.1016/j.redox.2020.101488. Epub 2020 Mar 9. Redox Biol. 2020. PMID: 32201219 Free PMC article. Review.
References
-
- Carrel L., Willard H.F. X-inactivation profile reveals extensive variability in X-linked gene expression in females. Nature. 2005;434:400–404. - PubMed
Publication types
MeSH terms
Substances
Grants and funding
LinkOut - more resources
Full Text Sources
Other Literature Sources
Molecular Biology Databases
