

Interleukin 1 receptor-associated kinase 1 (IRAK1) mutation is a common, essential driver for Kaposi sarcoma herpesvirus lymphoma
- PMID: 25341731
- PMCID: PMC4226132
- DOI: 10.1073/pnas.1405423111
Interleukin 1 receptor-associated kinase 1 (IRAK1) mutation is a common, essential driver for Kaposi sarcoma herpesvirus lymphoma
Erratum in
-
Correction for Yang et al., Interleukin 1 receptor-associated kinase 1 (IRAK1) mutation is a common, essential driver for Kaposi sarcoma herpesvirus lymphoma.Proc Natl Acad Sci U S A. 2015 May 5;112(18):E2412. doi: 10.1073/pnas.1505880112. Epub 2015 Apr 16. Proc Natl Acad Sci U S A. 2015. PMID: 25883263 Free PMC article. No abstract available.
Abstract
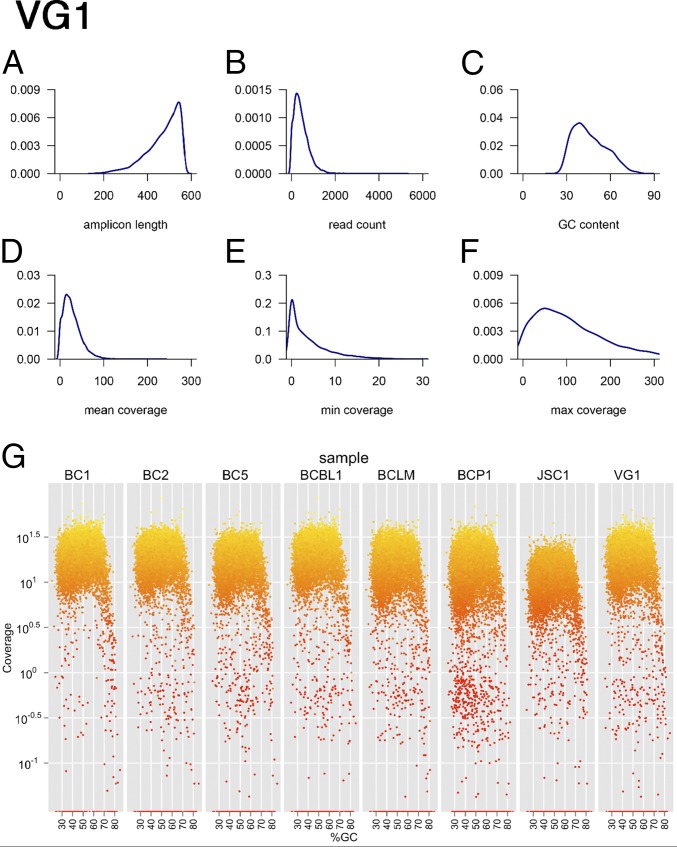
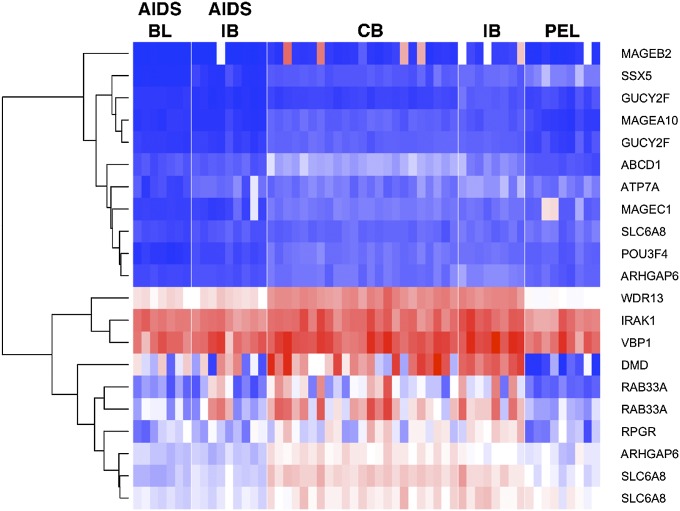
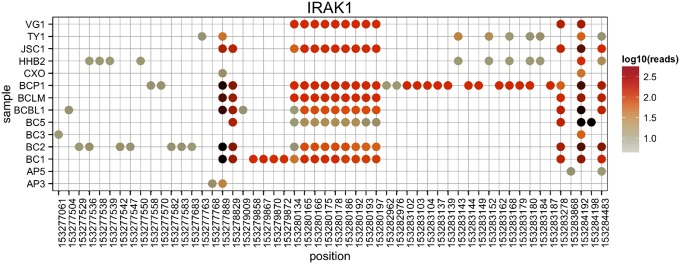
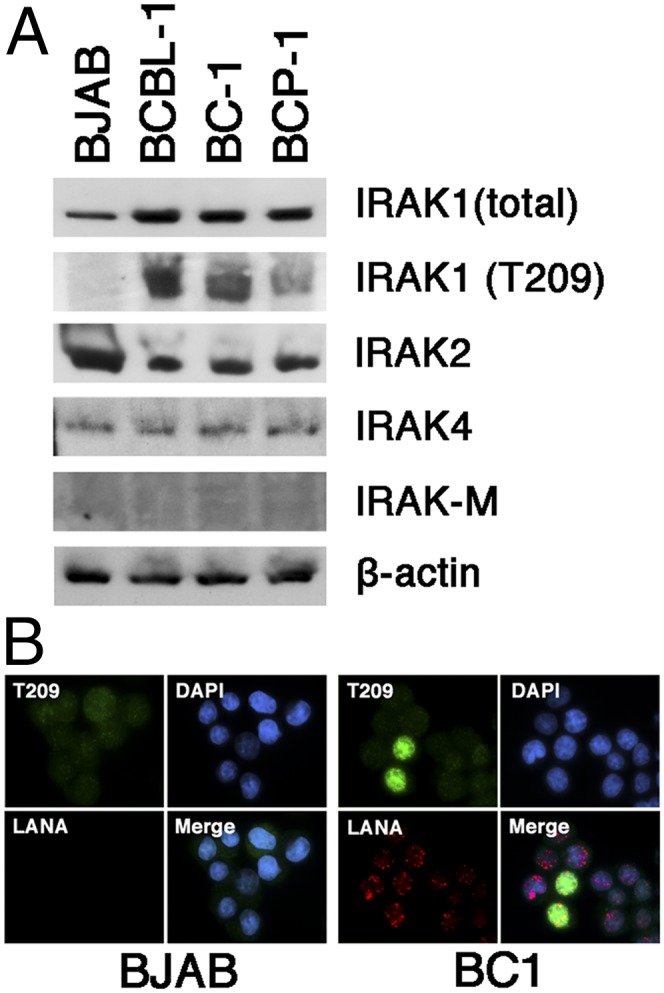
Primary effusion lymphoma (PEL) is an AIDS-defining cancer. All PELs carry Kaposi sarcoma-associated herpesvirus (KSHV). X chromosome-targeted sequencing of PEL identified 34 common missense mutations in 100% of cases. This included a Phe196Ser change in the interleukin 1 receptor-associated kinase 1 (IRAK1). The mutation was verified in primary PEL exudates. IRAK1 is the binding partner of MyD88, which is mutated in a fraction of Waldenström macroglobulinemia. Together, these two mediate toll-like receptor (TLR) signaling. IRAK1 was constitutively phosphorylated in PEL and required for survival, implicating IRAK1 and TLR signaling as a driver pathway in PEL and as a new drug development target.
Keywords: IRAK; Kaposi sarcoma; herpesviruses; myd88; primary effusion lymphoma.
Conflict of interest statement
The authors declare no conflict of interest.
Figures
Similar articles
-
Interleukin-1 Receptor-Associated Kinase (IRAK) Signaling in Kaposi Sarcoma-Associated Herpesvirus-Induced Primary Effusion Lymphoma.J Virol. 2020 May 4;94(10):e02123-19. doi: 10.1128/JVI.02123-19. Print 2020 May 4. J Virol. 2020. PMID: 32161170 Free PMC article.
-
Kaposi's sarcoma-associated herpesvirus microRNAs target IRAK1 and MYD88, two components of the toll-like receptor/interleukin-1R signaling cascade, to reduce inflammatory-cytokine expression.J Virol. 2012 Nov;86(21):11663-74. doi: 10.1128/JVI.01147-12. Epub 2012 Aug 15. J Virol. 2012. PMID: 22896623 Free PMC article.
-
PAX5 functions as a tumor suppressor by RB-E2F-mediated cell cycle arrest in Kaposi sarcoma-associated herpesvirus-infected primary effusion lymphoma.Neoplasia. 2024 Oct;56:101035. doi: 10.1016/j.neo.2024.101035. Epub 2024 Aug 2. Neoplasia. 2024. PMID: 39096792 Free PMC article.
-
Novel approaches to targeting MYD88 in Waldenström macroglobulinemia.Expert Rev Hematol. 2017 Aug;10(8):739-744. doi: 10.1080/17474086.2017.1343661. Epub 2017 Jun 28. Expert Rev Hematol. 2017. PMID: 28617062 Review.
-
Multiple viral infections in primary effusion lymphoma: a model of viral cooperation in lymphomagenesis.Expert Rev Hematol. 2017 Jun;10(6):505-514. doi: 10.1080/17474086.2017.1326815. Epub 2017 May 16. Expert Rev Hematol. 2017. PMID: 28468596 Review.
Cited by
-
The study of homology between tumor progression genes and members of retroviridae as a tool to predict target-directed therapy failure.Front Pharmacol. 2015 May 1;6:92. doi: 10.3389/fphar.2015.00092. eCollection 2015. Front Pharmacol. 2015. PMID: 25983693 Free PMC article.
-
Carcinogenic Parasite Secretes Growth Factor That Accelerates Wound Healing and Potentially Promotes Neoplasia.PLoS Pathog. 2015 Oct 20;11(10):e1005209. doi: 10.1371/journal.ppat.1005209. eCollection 2015 Oct. PLoS Pathog. 2015. PMID: 26485648 Free PMC article.
-
The Mitochondrial Ubiquitin Ligase MARCHF5 Cooperates with MCL1 to Inhibit Apoptosis in KSHV-Transformed Primary Effusion Lymphoma Cell Lines.bioRxiv [Preprint]. 2024 Sep 24:2024.09.23.614413. doi: 10.1101/2024.09.23.614413. bioRxiv. 2024. PMID: 39386614 Free PMC article. Preprint.
-
Role of Pattern Recognition Receptors in KSHV Infection.Cancers (Basel). 2018 Mar 20;10(3):85. doi: 10.3390/cancers10030085. Cancers (Basel). 2018. PMID: 29558453 Free PMC article. Review.
-
Targeting Myddosome Signaling in Waldenström's Macroglobulinemia with the Interleukin-1 Receptor-Associated Kinase 1/4 Inhibitor R191.Clin Cancer Res. 2018 Dec 15;24(24):6408-6420. doi: 10.1158/1078-0432.CCR-17-3265. Epub 2018 Aug 20. Clin Cancer Res. 2018. PMID: 30126942 Free PMC article.
References
-
- Cesarman E, Chang Y, Moore PS, Said JW, Knowles DM. Kaposi’s sarcoma-associated herpesvirus-like DNA sequences in AIDS-related body-cavity-based lymphomas. N Engl J Med. 1995;332(18):1186–1191. - PubMed
-
- Carbone A, Cesarman E, Spina M, Gloghini A, Schulz TF. HIV-associated lymphomas and gamma-herpesviruses. Blood. 2009;113(6):1213–1224. - PubMed
-
- Staudt MR, et al. The tumor microenvironment controls primary effusion lymphoma growth in vivo. Cancer Res. 2004;64(14):4790–4799. - PubMed
-
- Boshoff C, et al. Establishing a KSHV+ cell line (BCP-1) from peripheral blood and characterizing its growth in Nod/SCID mice. Blood. 1998;91(5):1671–1679. - PubMed
Publication types
MeSH terms
Substances
Associated data
Grants and funding
- P01 CA019014/CA/NCI NIH HHS/United States
- R21 CA177315/CA/NCI NIH HHS/United States
- R01 CA163217/CA/NCI NIH HHS/United States
- DE018304/DE/NIDCR NIH HHS/United States
- AI107810/AI/NIAID NIH HHS/United States
- R01 DE018304/DE/NIDCR NIH HHS/United States
- CA121947/CA/NCI NIH HHS/United States
- CA177315/CA/NCI NIH HHS/United States
- CA019014/CA/NCI NIH HHS/United States
- R01 DE023946/DE/NIDCR NIH HHS/United States
- U19 AI107810/AI/NIAID NIH HHS/United States
- U01 CA121947/CA/NCI NIH HHS/United States
- P30 AI050410/AI/NIAID NIH HHS/United States
LinkOut - more resources
Full Text Sources
Other Literature Sources
