Niclosamide ethanolamine-induced mild mitochondrial uncoupling improves diabetic symptoms in mice
- PMID: 25282357
- PMCID: PMC4299950
- DOI: 10.1038/nm.3699
Niclosamide ethanolamine-induced mild mitochondrial uncoupling improves diabetic symptoms in mice
Abstract
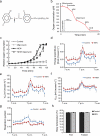
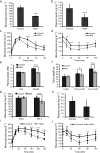
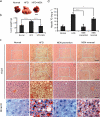
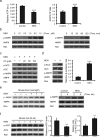
Type 2 diabetes (T2D) has reached an epidemic level globally. Most current treatments ameliorate the hyperglycemic symptom of the disease but are not effective in correcting its underlying cause. One important causal factor of T2D is ectopic accumulation of lipids in metabolically sensitive organs such as liver and muscle. Mitochondrial uncoupling, which reduces cellular energy efficiency and increases lipid oxidation, is an appealing therapeutic strategy. The challenge, however, is to discover safe mitochondrial uncouplers for practical use. Niclosamide is an anthelmintic drug approved by the US Food and Drug Administration that uncouples the mitochondria of parasitic worms. Here we show that niclosamide ethanolamine salt (NEN) uncouples mammalian mitochondria at upper nanomolar concentrations. Oral NEN increases energy expenditure and lipid metabolism in mice. It is also efficacious in preventing and treating hepatic steatosis and insulin resistance induced by a high-fat diet. Moreover, it improves glycemic control and delays disease progression in db/db mice. Given the well-documented safety profile of NEN, our study provides a potentially new and practical pharmacological approach for treating T2D.
Figures


Comment in
-
Diabetes: antihelminthic drug for T2DM therapy?Nat Rev Endocrinol. 2014 Dec;10(12):702. doi: 10.1038/nrendo.2014.183. Epub 2014 Oct 21. Nat Rev Endocrinol. 2014. PMID: 25331287 No abstract available.
-
Metabolic disease: Mitochondrial uncoupler reverses diabetes.Nat Rev Drug Discov. 2014 Dec;13(12):885. doi: 10.1038/nrd4491. Epub 2014 Nov 14. Nat Rev Drug Discov. 2014. PMID: 25394871 No abstract available.
Similar articles
-
Niclosamide piperazine prevents high-fat diet-induced obesity and diabetic symptoms in mice.Eat Weight Disord. 2019 Feb;24(1):91-96. doi: 10.1007/s40519-017-0424-7. Epub 2017 Aug 5. Eat Weight Disord. 2019. PMID: 28780747
-
N-substituted phenylbenzamides of the niclosamide chemotype attenuate obesity related changes in high fat diet fed mice.PLoS One. 2018 Oct 25;13(10):e0204605. doi: 10.1371/journal.pone.0204605. eCollection 2018. PLoS One. 2018. PMID: 30359371 Free PMC article.
-
Repositioning of niclosamide ethanolamine (NEN), an anthelmintic drug, for the treatment of lipotoxicity.Free Radic Biol Med. 2019 Jun;137:143-157. doi: 10.1016/j.freeradbiomed.2019.04.030. Epub 2019 Apr 26. Free Radic Biol Med. 2019. PMID: 31035006
-
Effect of mitochondrial uncouplers niclosamide ethanolamine (NEN) and oxyclozanide on hepatic metastasis of colon cancer.Cell Death Dis. 2018 Feb 13;9(2):215. doi: 10.1038/s41419-017-0092-6. Cell Death Dis. 2018. PMID: 29440715 Free PMC article.
-
Niclosamide ethanolamine improves kidney injury in db/db mice.Diabetes Res Clin Pract. 2018 Oct;144:25-33. doi: 10.1016/j.diabres.2018.08.003. Epub 2018 Aug 4. Diabetes Res Clin Pract. 2018. PMID: 30081104
Cited by
-
Repurposed Drugs That Activate Autophagy in Filarial Worms Act as Effective Macrofilaricides.Pharmaceutics. 2024 Feb 9;16(2):256. doi: 10.3390/pharmaceutics16020256. Pharmaceutics. 2024. PMID: 38399310 Free PMC article.
-
Repurposing Niclosamide to Modulate Renal RNA-Binding Protein HuR for the Treatment of Diabetic Nephropathy in db/db Mice.Int J Mol Sci. 2024 Sep 6;25(17):9651. doi: 10.3390/ijms25179651. Int J Mol Sci. 2024. PMID: 39273597 Free PMC article.
-
Synergistic Activity of Niclosamide in Combination With Colistin Against Colistin-Susceptible and Colistin-Resistant Acinetobacter baumannii and Klebsiella pneumoniae.Front Cell Infect Microbiol. 2018 Oct 3;8:348. doi: 10.3389/fcimb.2018.00348. eCollection 2018. Front Cell Infect Microbiol. 2018. PMID: 30338245 Free PMC article.
-
Niclosamide Revitalizes Sorafenib through Insulin-like Growth Factor 1 Receptor (IGF-1R)/Stemness and Metabolic Changes in Hepatocellular Carcinoma.Cancers (Basel). 2023 Feb 1;15(3):931. doi: 10.3390/cancers15030931. Cancers (Basel). 2023. PMID: 36765890 Free PMC article.
-
Thermogenic T cells: a cell therapy for obesity?Am J Physiol Cell Physiol. 2022 Jun 1;322(6):C1085-C1094. doi: 10.1152/ajpcell.00034.2022. Epub 2022 Apr 27. Am J Physiol Cell Physiol. 2022. PMID: 35476503 Free PMC article. Review.
References
-
- Center for Disease Control and Prevention 2011 National Diabetes Fact Sheet. 2011
-
- Qaseem A, Humphrey LL, Sweet DE, Starkey M, Shekelle P. Oral pharmacologic treatment of type 2 diabetes mellitus: a clinical practice guideline from the American College of Physicians. Ann Intern Med. 2012;156:218–231. - PubMed
-
- Nathan DM, et al. Medical management of hyperglycemia in type 2 diabetes: a consensus algorithm for the initiation and adjustment of therapy: a consensus statement of the American Diabetes Association and the European Association for the Study of Diabetes. Diabetes Care. 2009;32:193–203. - PMC - PubMed
-
- Kahn SE, Hull RL, Utzschneider KM. Mechanisms linking obesity to insulin resistance and type 2 diabetes. Nature. 2006;444:840–846. - PubMed
Publication types
MeSH terms
Substances
Grants and funding
- U24 DK092993/DK/NIDDK NIH HHS/United States
- P30 CA072720/CA/NCI NIH HHS/United States
- P30 DK45735/DK/NIDDK NIH HHS/United States
- U24 DK059635/DK/NIDDK NIH HHS/United States
- R01 DK040936/DK/NIDDK NIH HHS/United States
- R24 DK085638/DK/NIDDK NIH HHS/United States
- U24 DK093000/DK/NIDDK NIH HHS/United States
- P30 DK045735/DK/NIDDK NIH HHS/United States
- R01CA116088/CA/NCI NIH HHS/United States
- R01 AG030081/AG/NIA NIH HHS/United States
- R01AG030081/AG/NIA NIH HHS/United States
- P30 DK034989/DK/NIDDK NIH HHS/United States
- U24 DK076174/DK/NIDDK NIH HHS/United States
- R01 CA116088/CA/NCI NIH HHS/United States
- HHMI/Howard Hughes Medical Institute/United States
LinkOut - more resources
Full Text Sources
Other Literature Sources
Molecular Biology Databases
Miscellaneous

