. 2014 Dec 1;20(23):6083-95.
doi: 10.1158/1078-0432.CCR-14-0493. Epub 2014 Sep 17.

Effects of tumor microenvironment heterogeneity on nanoparticle disposition and efficacy in breast cancer tumor models

Affiliations

Effects of tumor microenvironment heterogeneity on nanoparticle disposition and efficacy in breast cancer tumor models

Gina Song et al. Clin Cancer Res. .

Abstract

Purpose: Tumor cells are surrounded by a complex microenvironment. The purpose of our study was to evaluate the role of heterogeneity of the tumor microenvironment in the variability of nanoparticle (NP) delivery and efficacy.

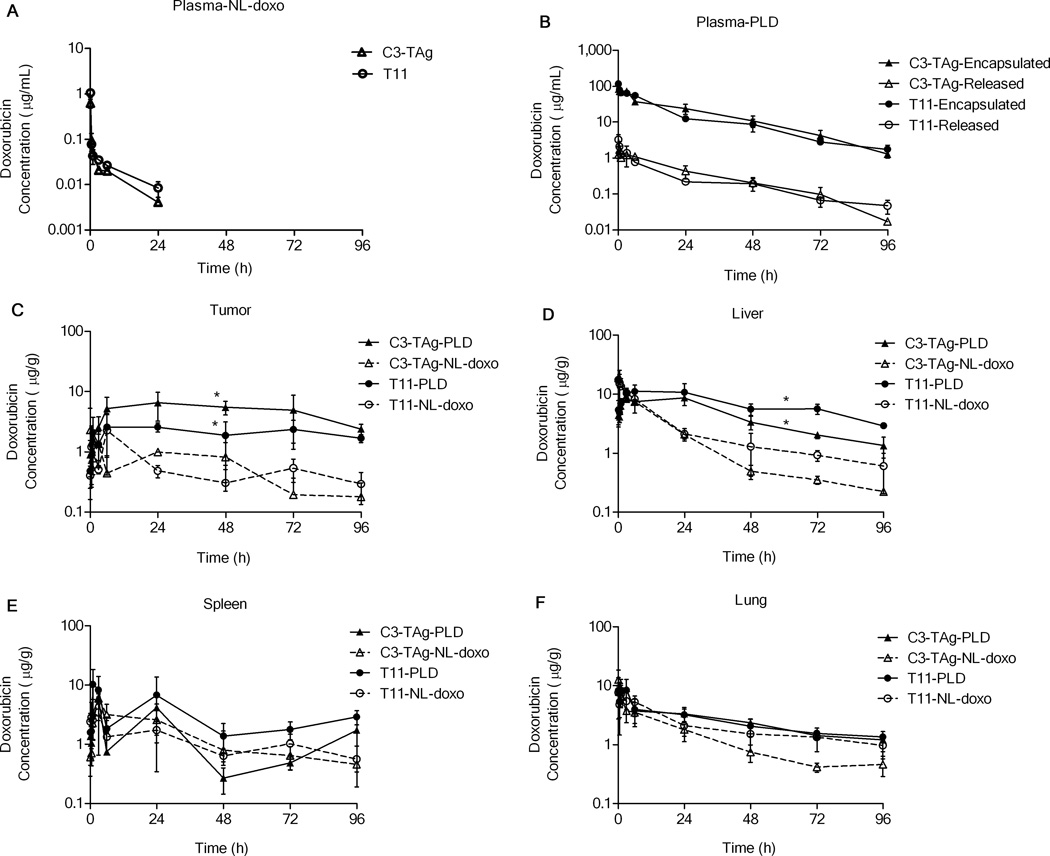
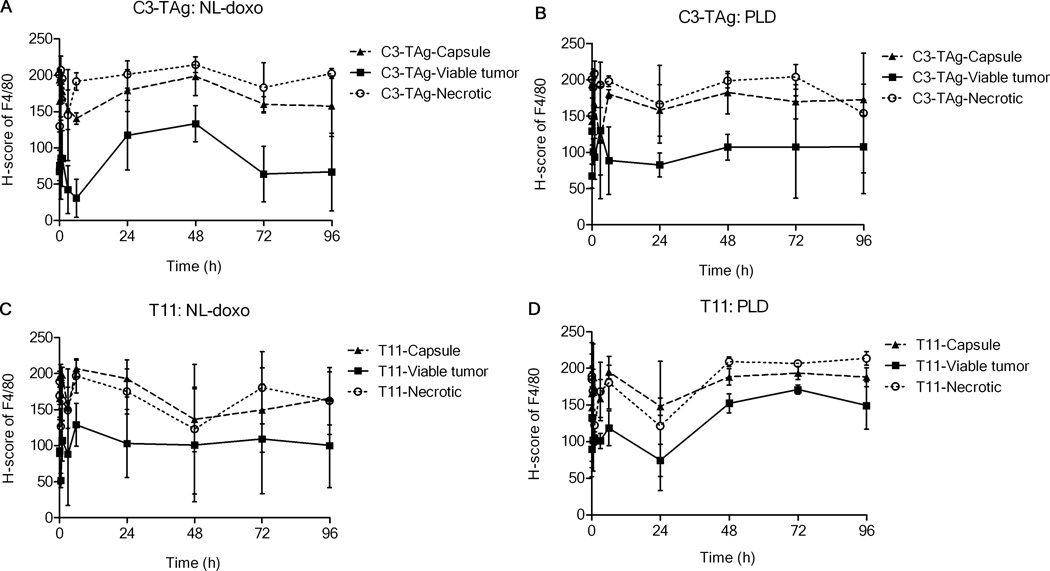
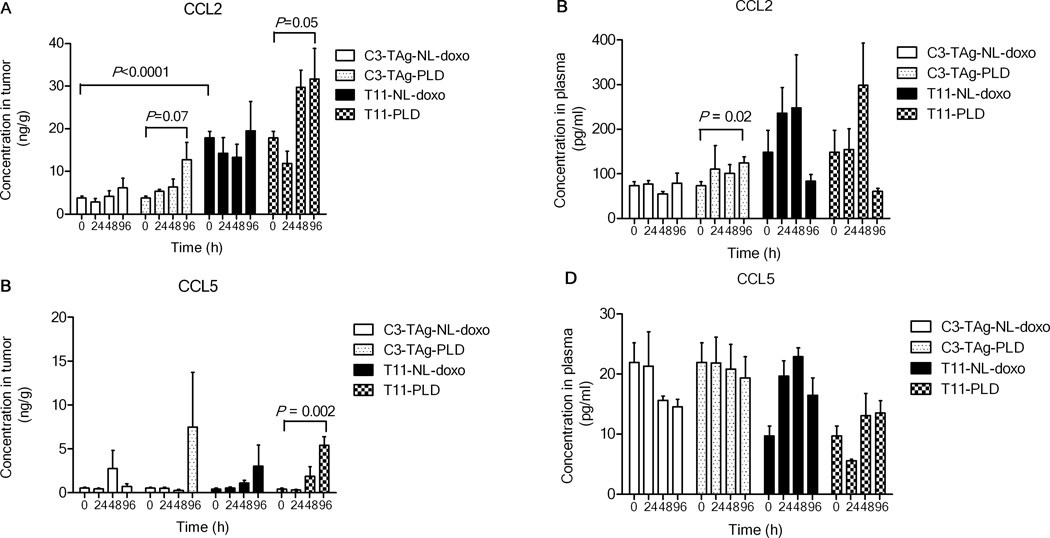
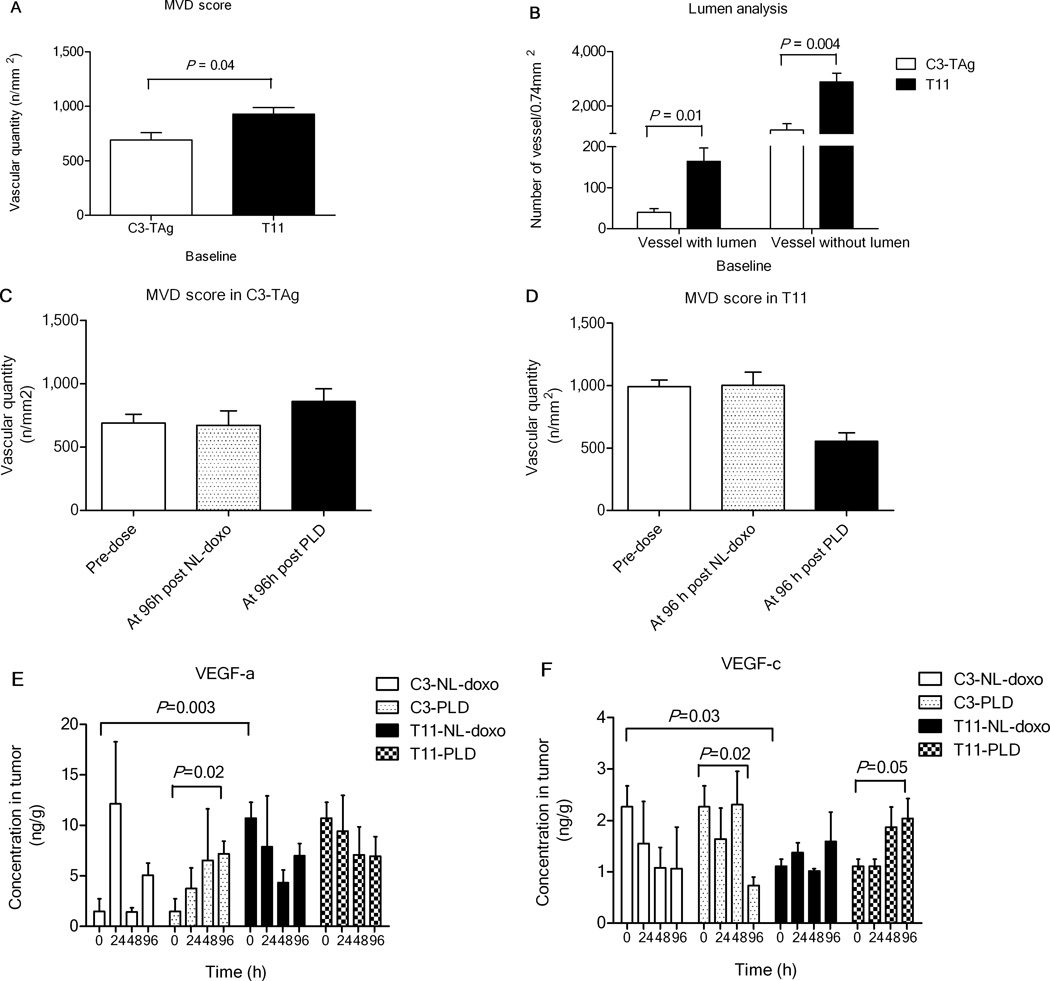
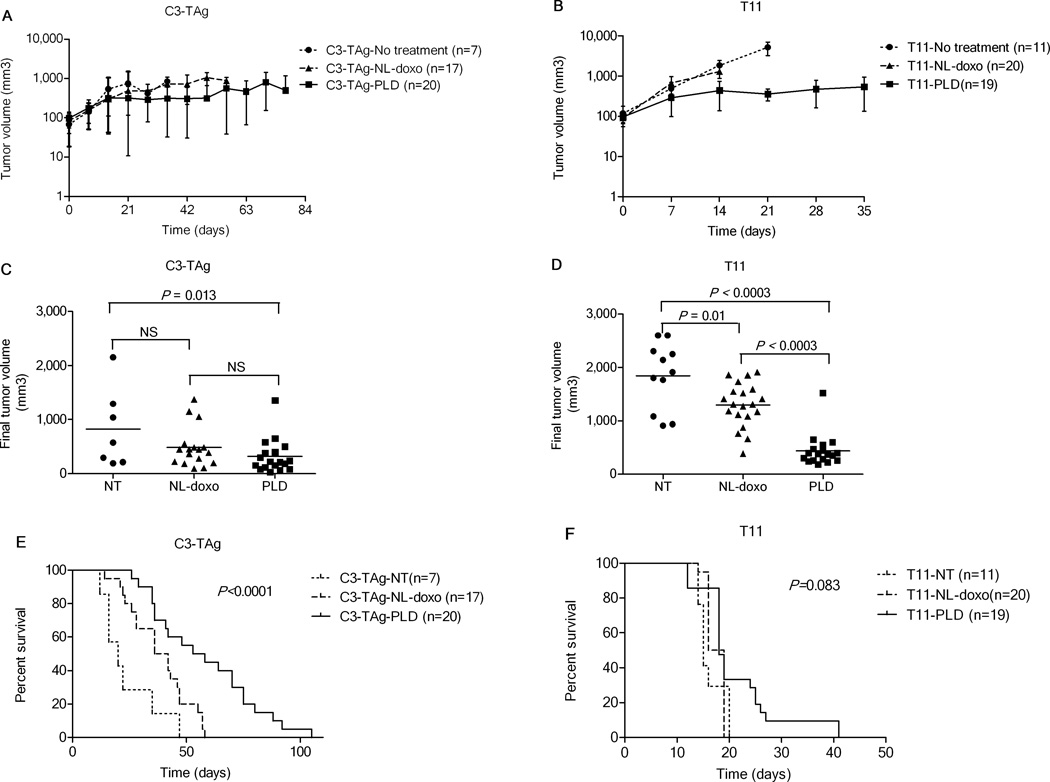
Experimental designs: C3(1)-T-Antigen genetically engineered mouse model (C3-TAg) and T11/TP53(Null) orthotopic syngeneic murine transplant model (T11) representing human breast tumor subtypes basal-like and claudin-low, respectively, were evaluated. For the pharmacokinetic studies, non-liposomal doxorubicin (NL-doxo) or polyethylene glycol tagged (PEGylated) liposomal doxorubicin (PLD) was administered at 6 mg/kg i.v. x1. Area under the concentration versus time curve (AUC) of doxorubicin was calculated. Macrophages, collagen, and the amount of vasculature were assessed by IHC. Chemokines and cytokines were measured by multiplex immunochemistry. NL-doxo or PLD was administered at 6 mg/kg i.v. weekly x6 in efficacy studies. Analyses of intermediary tumor response and overall survival were performed.

Results: Plasma AUC of NL-doxo and PLD encapsulated and released doxorubicin was similar between two models. However, tumor sum total AUC of PLD was 2-fold greater in C3-TAg compared with T11 (P < 0.05). T11 tumors showed significantly higher expression of CC chemokine ligand (CCL) 2 and VEGF-a, greater vascular quantity, and decreased expression of VEGF-c compared with C3-TAg (P < 0.05). PLD was more efficacious compared with NL-doxo in both models.

Conclusion: The tumor microenvironment and/or tumor cell features of breast cancer affected NP tumor delivery and efficacy, but not the small-molecule drug. Our findings reveal the role of the tumor microenvironment in variability of NP delivery and therapeutic outcomes.


Conflict of interest statement

Conflict of Interest: The authors declare no competing financial interest.

Figures

Figure 1
Figure 1
Concentration versus time profiles of doxorubicin after administration of PLD or NL-doxo at 6 mg/kg I.V. × 1 via tail vein in (A and B) plasma, (C) tumor, (D) liver, (E) spleen, and (F) lung in basal-like C3-TAg and claudin-low T11 breast tumor models. Samples (n=3 mice at each time point) were obtained at 0.083, 0.5, 1, 3, 6, 24, 48, 72, and 96 hours following PLD or NL-doxo administration. Encapsulated and released doxorubicin after administration of PLD in plasma (B) and sum total (encapsulated and released) doxorubicin in tumor and tissues (C-F) are presented. Each time point is represented as the mean ± standard deviation (SD). *P<0.05 (AUC0–96h in the C3-TAg model versus AUC0–96h in the T11 model). Equality of AUC was tested using Nedelman’s modification of the Bailer method for sparse samples, using a two-sample test (32). LLOQ for encapsulated doxorubicin: 300 ng/mL, released doxorubicin: 10 ng/mL, and sum total doxorubicin in tissue: 10 ng/g. NL-doxo= NL-doxorubicin. LLOQ= lower limit of quantification.
Figure 2
Figure 2
Hematoxylin & Eosin (H&E), and immunostaining of F4/80, Collagen IV, and CD31 in tumors from basal-like C3-TAg and claudin-low T11 breast tumor models. Representative staining of tumors (brown staining in positive cells) at baseline in the C3-TAg and the T11 models are shown. (A) Representative C3-TAg tumor sections stained for (i) H&E, (ii) F4/80, (iii) Collagen IV and (iv) CD31. (B) Representative T11 tumor sections stained for (i) H&E, (ii) F4/80, (iii) Collagen IV and (iv) CD31. (C) Digital images of (i) F4/80-, (ii) Collagen IV-, and (iii) CD31-stained T11 tumor sections after analysis using the Aperio Membrane v9 algorithm and color deconvolution methods for F4/80 and Collagen IV, respectively, and the Definiens Tissue Studio software for CD31. The markup images of (i) F4/80 and (ii) collagen IV highlight the staining which is color-coded according to their cell classification based on staining intensity (blue= undetectable, yellow= weak, orange= medium, and red= strong). The image of (iii) CD31 highlights the staining which is color-coded based on the size of the detected vessels (yellow=small, orange=intermediate, and red=large). The vascular size was defined as small < 40 µm2, medium 40 µm2 ≤ and < 400 µm2, and large ≥ 400 µm2. Digital image of each stained slide was scanned using the Aperio ScanScope XT at an apparent 20X magnification.
Figure 3
Figure 3
F4/80 H-score in tumor versus time profiles in basal-like C3-TAg and claudin-low T11 breast tumor models after administration of PLD or NL-doxo at 6 mg/kg I.V. × 1 via tail vein. F4/80 H-score over time in the C3-TAg tumors following (A) NL-doxo and (B) PLD administration. F4/80 H-score over time in the T11 tumors following (C) NL-doxo and (D) PLD administration. NL-doxo and PLD affected the infiltration of TAMs over time in a drug- and tumor type-dependent manner. Each time point is represented as mean ± SD (n=3). Capsule: Peritumoral/Peripheral tumor; Viable tumor: Intratumoral viable tumor; Necrotic: Intratumoral necrotic tumor. NL-doxo= NL-doxorubicin. TAMs= tumor-associated macrophages.
Figure 4
Figure 4
Profiling of CC chemokine ligands (CCL)2 and CCL5 in basal-like C3-TAg and claudin-low T11 breast tumor models after administration of PLD or NL-doxo at 6 mg/kg I.V. × 1 via tail vein. (A) Intratumoral CCL2 concentrations versus time profiles and (B) plasma CCL2 concentration versus time profiles after PLD or NL-doxo administration in the C3-TAg and the T11 models. The baseline intratumoral expressions of CCL2 were significantly higher in the T11 compared to the C3-TAg (P<0.0001). PLD strongly induced the secretion of CCL2 over 96 h in the C3-TAg (P=0.07) and the T11 tumors (P=0.05) when compared to the slightly increased CCL2 secretion after NL-doxo administration in both models. In plasma, baseline CCL2 concentrations were 2-fold higher in the T11 model compared to the C3-TAg model (P=0.19). Plasma CCL2 concentration was significantly increased at 96 h after PLD in the C3-TAg model (P=0.02), but little was changed in the T11 model. (C) Intratumoral CCL5 concentrations versus time profiles and (D) plasma CCL5 concentrations versus time after PLD or NL-doxo administration in the C3-TAg and the T11 models. There was no difference in the baseline intratumoral CCL5 concentrations between the two models. After PLD administration, T11 tumors showed significantly increased CCL5 concentrations at 96 hour (P=0.002), but a high variability was observed at 96 hour in the C3-TAg model (P=0.24). In plasma, the baseline CCL5 concentrations were similar between the two models and little change was observed after PLD or NL-doxo administration in both models. Data are presented as mean ± SEM (n=3 per each time point). P-values were calculated using t-test for the baseline comparison and for the change from baseline to 96 h after PLD or NL-doxo administration.
Figure 5
Figure 5
The amount of vasculature and the levels of VEGF-a and VEGF-c in basal-like C3-TAg and claudin-low T11 breast tumor models at baseline and at 96 h after administration of PLD or NL-doxo at 6 mg/kg I.V. × 1 via tail vein. (A) MVD score (number of CD31-positive objects per unit area) at baseline in the C3-TAg and the T11 tumors. The T11 tumors had a significantly greater amount of the blood vessel endothelial cells (BECs) compared to the C3-TAg tumors (P=0.04). BECs in the tumor capsule and the viable tumor were assessed for analysis. (B) Open lumen analysis of baseline tumor blood vessels in the C3-TAg and the T11 tumors showed a significantly higher number of blood vessels with lumen in the T11 tumors compared to the C3-TAg tumors (P=0.01). MVD score at baseline and at 96 h after NL-doxo or PLD in (C) the C3-TAg and (D) the T11 tumors. Note that there was little change in the amount of the vasculature in the C3-TAg tumors after NL-doxo or PLD, but a 30% decrease in the MVD score was observed in the T11 tumors after PLD administration. Five most vascularized areas within the tumors (‘hotspot’/0.74 mm2) were chosen for evaluation of the presence of lumen in the blood vasculature. Each of these five areas was analyzed and the mean was calculated per slide. Intratumoral concentrations of (E) VEGF-a and (F) VEGF-c versus time profiles after PLD or NL-doxo in the C3-TAg and the T11 tumors. T11 tumors had significantly higher levels of VEGF-a (P=0.003) and decreased levels of VEGF-c (P=0.03) compared to C3-TAg tumors. PLD had greater impacts on the levels of VEGF-a (P=0.02) and VEGF-c (P=0.02 and P=0.05) compared to NL-doxo and the effects appeared to vary with breast tumor subtypes. Data are presented as mean ± SEM (n=3 or 4). P-values were calculated using unpaired t-test.
Figure 6
Figure 6
Efficacy studies of no treatment, NL-doxo, and PLD in basal-like C3-TAg and claudin-low T11 breast tumor models after administration of PLD or NL-doxo at 6 mg/kg I.V. every week for 6 weeks. Mean tumor growth curves in (A) the C3-TAg and (B) the T11 models. Data are presented as the mean ± SD. Intermediary tumor volumes at (C) 21 days post treatment for the C3-TAg model and at (D) 14 days post treatment for the T11 model. Mean tumor volume comparison indicated that PLD was more efficacious at suppressing tumor growth in the C3-TAg compared to no treatment (P=0.013) and in the T11 compared to no treatment or NL-doxo (P<0.0003 for both). P-values were calculated based on adjusted tumor volume, using analysis of covariance (ANCOVA) followed by adjustment for multiple comparisons using Holm test. Baseline tumor volume was considered as covariate. Kaplan-Meier (KM) analysis of survival after no treatment, NL-doxo, or PLD administration in (E) the C3-TAg and (F) the T11 models was performed. P-values were calculated using two-sided log-rank test. Survival was measured from the first day of drug treatment. 7/7 (no treatment), 17/20 (NL-doxo), and 20/20 (PLD) of the C3-TAg mice were analyzed for the efficacy studies. 11/11 (no treatment), 20/20 (NL-doxo), and 19/20 (PLD) of T11 mice were analyzed for the efficacy studies.

Similar articles

Cited by

References

    1. Farokhzad OC, Langer R. Impact of nanotechnology on drug delivery. ACS nano. 2009;3(1):16–20. - PubMed
    1. Peer D, Karp JM, Hong S, Farokhzad OC, Margalit R, Langer R. Nanocarriers as an emerging platform for cancer therapy. Nature nanotechnology. 2007;2(12):751–60. - PubMed
    1. Maeda H, Greish K, Fang J. Polymer Therapeutics II. Springer; 2006. The EPR effect and polymeric drugs: A paradigm shift for cancer chemotherapy in the 21st century; pp. 103–221.
    1. Zamboni WC. Concept and clinical evaluation of carrier-mediated anticancer agents. Oncologist. 2008;13(3):248–60. - PubMed
    1. Prabhakar U, Maeda H, Jain RK, Sevick-Muraca EM, Zamboni W, Farokhzad OC, et al. Challenges and key considerations of the enhanced permeability and retention effect for nanomedicine drug delivery in oncology. Cancer Res. 2013;73(8):2412–7. - PMC - PubMed

Publication types

MeSH terms