Regulation of fatty acid composition and lipid storage by thyroid hormone in mouse liver
- PMID: 25105012
- PMCID: PMC4124172
- DOI: 10.1186/2045-3701-4-38
Regulation of fatty acid composition and lipid storage by thyroid hormone in mouse liver
Abstract
Background: Thyroid hormones (THs) are potent hormones modulating liver lipid homeostasis. The perturbation of lipid homeostasis is a hallmark of non-alcoholic fatty liver disease (NAFLD), a very common liver disorder. It was reported that NAFLD patients were associated with higher incidence of hypothyroidism. However, whether abnormal thyroid function contributes to the pathogenesis of NAFLD remains unclear.
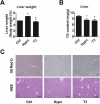
Results: We used in vivo models to investigate the influence of hypothyroidism and TH on hepatic lipid homeostasis. We did not observe hepatic triglyceride accumulation in the liver of hypothyroid mice, although the liver was enlarged. We then characterized the hepatic fatty acid composition with gas chromatography-mass spectrometry in mice under different thyroid states. We found that hypothyroidism decreased saturated fatty acid (SFA) content while TH treatment restored the level of SFA. In agreement with this finding, we observed that the expression of acetyl-CoA carboxylase 1 and fatty acid synthase, the rate-limit enzymes for de novo lipogenesis (DNL), decreased in hypothyroid mice while increased after TH treatment. We also found that the ratio of C18:1n-9/C18:0 and C16:1n-7/C16:0 was decreased by TH treatment, suggesting the activity of stearoyl-CoA desaturase-1 was suppressed. This finding indicated that TH is able to suppress triglyceride accumulation by reducing fatty acid desaturation. Additionally, we found that hepatic glycogen content was substantially influenced by TH status, which was associated with glycogen synthase expression. The increased glycogen storage might explain the enlarged liver we observed in hypothyroid mice.
Conclusions: Taken together, our study here suggested that hypothyroidism in mice might not lead to the development of NAFLD although the liver became enlarged. However, disturbed TH levels led to altered hepatic fatty acid composition and glycogen accumulation.
Keywords: Fatty acid; Glycogen; Liver; NAFLD; Thyroid hormone.
Figures


Similar articles
-
Pathogenesis of hypothyroidism-induced NAFLD is driven by intra- and extrahepatic mechanisms.Proc Natl Acad Sci U S A. 2017 Oct 24;114(43):E9172-E9180. doi: 10.1073/pnas.1707797114. Epub 2017 Oct 10. Proc Natl Acad Sci U S A. 2017. PMID: 29073114 Free PMC article.
-
Nonalcoholic Fatty Liver Disease and Hypercholesterolemia: Roles of Thyroid Hormones, Metabolites, and Agonists.Thyroid. 2019 Sep;29(9):1173-1191. doi: 10.1089/thy.2018.0664. Thyroid. 2019. PMID: 31389309 Free PMC article. Review.
-
Interplay between Thyroid Hormones and Stearoyl-CoA Desaturase 1 in the Regulation of Lipid Metabolism in the Heart.Int J Mol Sci. 2020 Dec 24;22(1):109. doi: 10.3390/ijms22010109. Int J Mol Sci. 2020. PMID: 33374300 Free PMC article.
-
Understanding the Relationship between Nonalcoholic Fatty Liver Disease and Thyroid Disease.Int J Mol Sci. 2023 Sep 27;24(19):14605. doi: 10.3390/ijms241914605. Int J Mol Sci. 2023. PMID: 37834051 Free PMC article. Review.
-
Characteristics of hepatic fatty acid compositions in patients with nonalcoholic steatohepatitis.Liver Int. 2015 Feb;35(2):582-90. doi: 10.1111/liv.12685. Epub 2014 Oct 10. Liver Int. 2015. PMID: 25219574
Cited by
-
Fatty acid synthesis suppresses dietary polyunsaturated fatty acid use.Nat Commun. 2024 Jan 2;15(1):45. doi: 10.1038/s41467-023-44364-y. Nat Commun. 2024. PMID: 38167725 Free PMC article.
-
Conferring liver selectivity to a thyromimetic using a novel nanoparticle increases therapeutic efficacy in a diet-induced obesity animal model.PNAS Nexus. 2023 Aug 29;2(8):pgad252. doi: 10.1093/pnasnexus/pgad252. eCollection 2023 Aug. PNAS Nexus. 2023. PMID: 37649581 Free PMC article.
-
Iodide Excess Inhibits Thyroid Hormone Synthesis Pathway Involving XBP1-Mediated Regulation.Nutrients. 2023 Feb 9;15(4):887. doi: 10.3390/nu15040887. Nutrients. 2023. PMID: 36839245 Free PMC article.
-
Important Hormones Regulating Lipid Metabolism.Molecules. 2022 Oct 19;27(20):7052. doi: 10.3390/molecules27207052. Molecules. 2022. PMID: 36296646 Free PMC article. Review.
-
Insight into Potential Interactions of Thyroid Hormones, Sex Hormones and Their Stimulating Hormones in the Development of Non-Alcoholic Fatty Liver Disease.Metabolites. 2022 Aug 4;12(8):718. doi: 10.3390/metabo12080718. Metabolites. 2022. PMID: 36005590 Free PMC article. Review.
References
-
- Surks MI, Ortiz E, Daniels GH, Sawin CT, Col NF, Cobin RH, Franklyn JA, Hershman JM, Burman KD, Denke MA, Gorman C, Cooper RS, Weissman NJ, Gorman C, Cooper RS, Weissman NJ. Subclinical thyroid disease: scientific review and guidelines for diagnosis and management. JAMA. 2004;291:228–238. doi: 10.1001/jama.291.2.228. - DOI - PubMed
-
- Refetoff S, Weiss RE, Usala SJ. The syndromes of resistance to thyroid hormone. Endocr Rev. 1993;14:348–399. - PubMed
LinkOut - more resources
Full Text Sources
Other Literature Sources

