

Insulin receptor substrates are essential for the bioenergetic and hypertrophic response of the heart to exercise training
- PMID: 25002528
- PMCID: PMC4135616
- DOI: 10.1128/MCB.00426-14
Insulin receptor substrates are essential for the bioenergetic and hypertrophic response of the heart to exercise training
Abstract
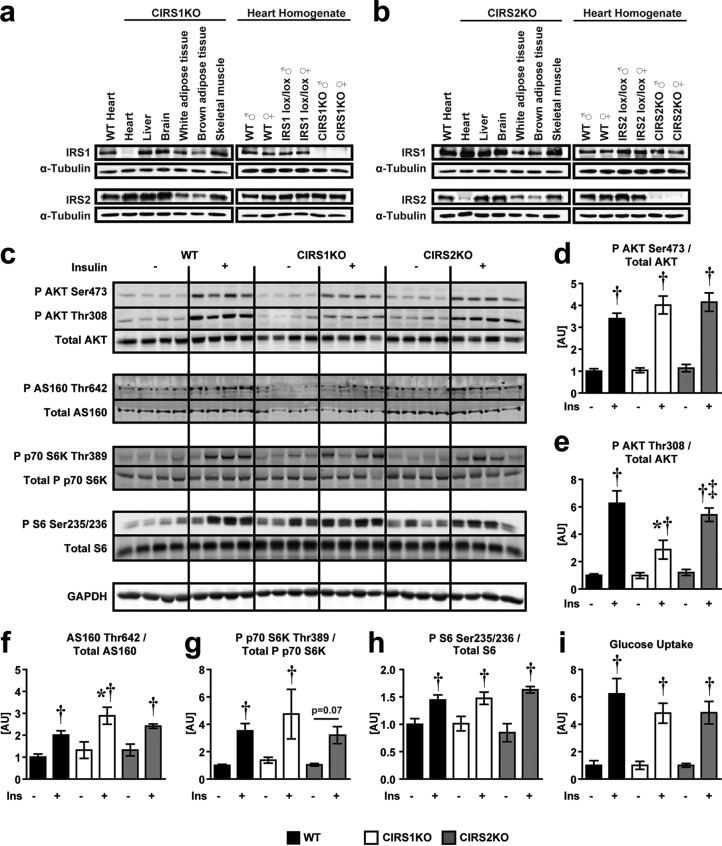
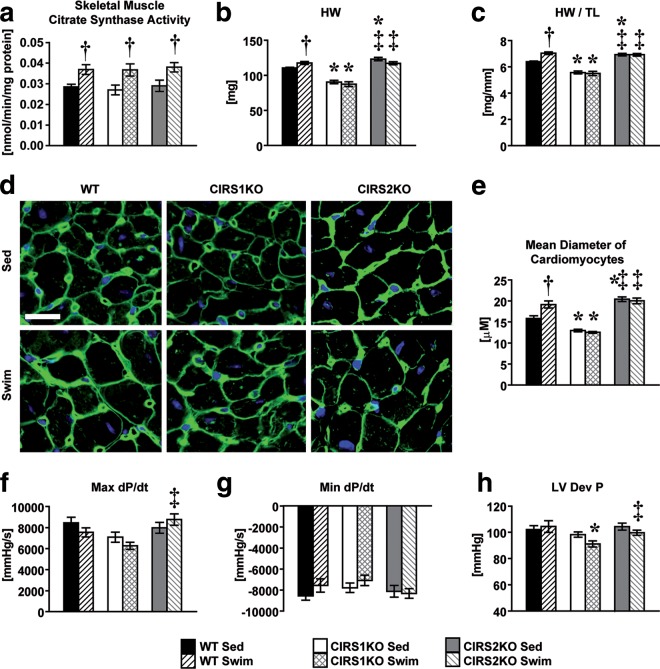
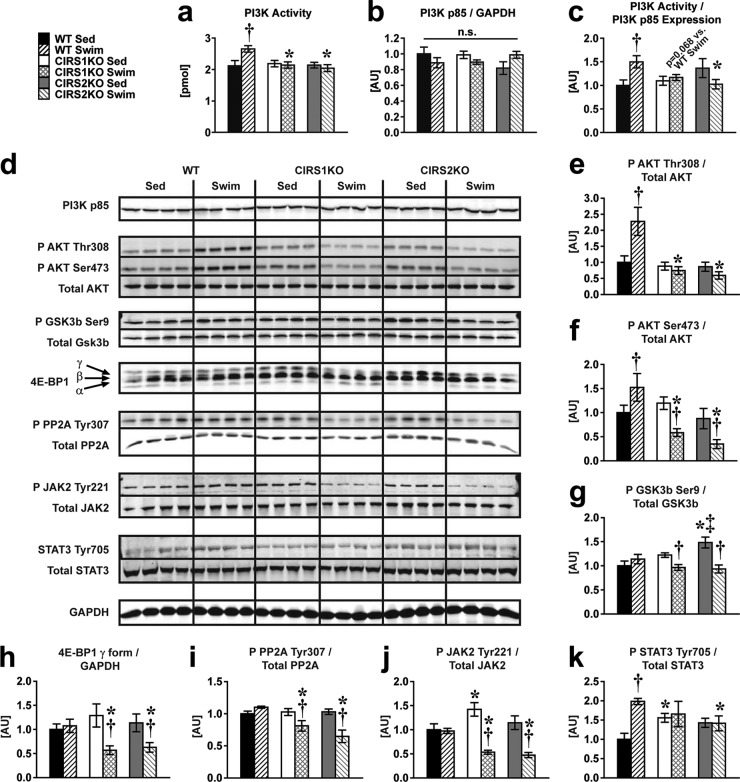
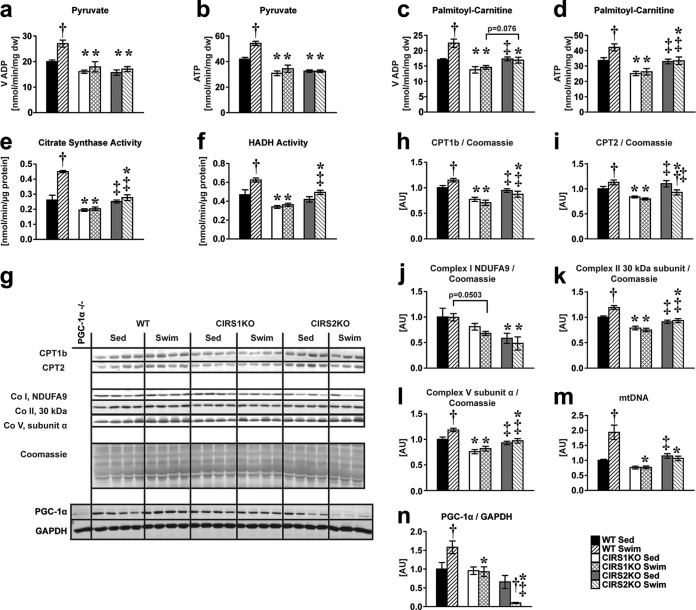
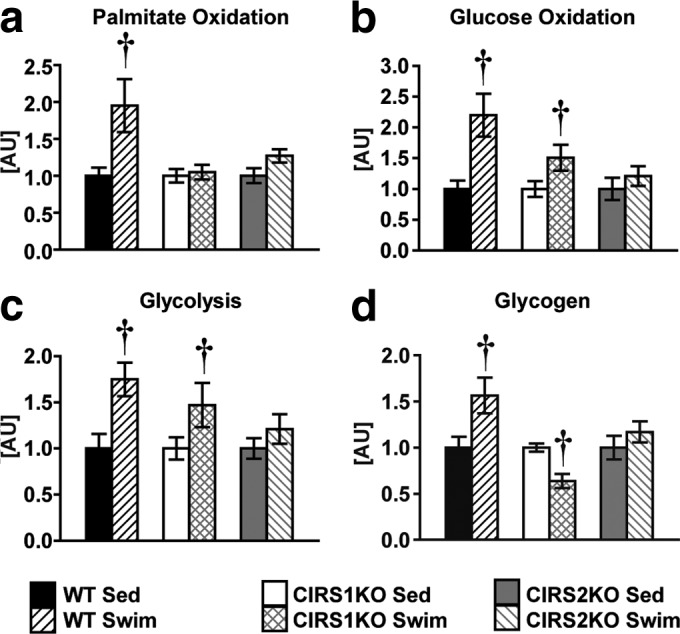
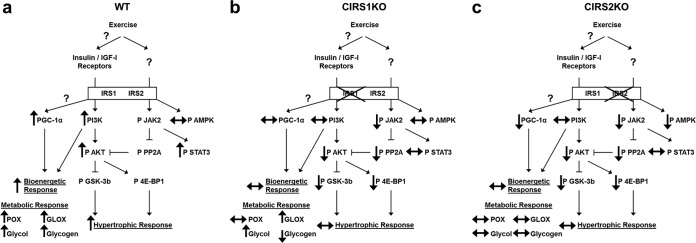
Insulin and insulin-like growth factor 1 (IGF-1) receptor signaling pathways differentially modulate cardiac growth under resting conditions and following exercise training. These effects are mediated by insulin receptor substrate 1 (IRS1) and IRS2, which also differentially regulate resting cardiac mass. To determine the role of IRS isoforms in mediating the hypertrophic and metabolic adaptations of the heart to exercise training, we subjected mice with cardiomyocyte-specific deletion of either IRS1 (CIRS1 knockout [CIRS1KO] mice) or IRS2 (CIRS2KO mice) to swim training. CIRS1KO hearts were reduced in size under basal conditions, whereas CIRS2KO hearts exhibited hypertrophy. Following exercise swim training in CIRS1KO and CIRS2KO hearts, the hypertrophic response was equivalently attenuated, phosphoinositol 3-kinase (PI3K) activation was blunted, and prohypertrophic signaling intermediates, such as Akt and glycogen synthase kinase 3β (GSK3β), were dephosphorylated potentially on the basis of reduced Janus kinase-mediated inhibition of protein phosphatase 2a (PP2A). Exercise training increased peroxisome proliferator-activated receptor gamma coactivator 1-alpha (PGC-1α) protein content, mitochondrial capacity, fatty acid oxidation, and glycogen synthesis in wild-type (WT) controls but not in IRS1- and IRS2-deficient hearts. PGC-1α protein content remained unchanged in CIRS1KO but decreased in CIRS2KO hearts. These results indicate that although IRS isoforms play divergent roles in the developmental regulation of cardiac size, these isoforms exhibit nonredundant roles in mediating the hypertrophic and metabolic response of the heart to exercise.
Copyright © 2014, American Society for Microbiology. All Rights Reserved.
Figures
Similar articles
-
Insulin-like growth factor I receptor signaling is required for exercise-induced cardiac hypertrophy.Mol Endocrinol. 2008 Nov;22(11):2531-43. doi: 10.1210/me.2008-0265. Epub 2008 Sep 18. Mol Endocrinol. 2008. PMID: 18801929 Free PMC article.
-
Insulin receptor substrates differentially exacerbate insulin-mediated left ventricular remodeling.JCI Insight. 2020 Mar 26;5(6):e134920. doi: 10.1172/jci.insight.134920. JCI Insight. 2020. PMID: 32213702 Free PMC article.
-
Skeletal muscle-specific expression of PGC-1α-b, an exercise-responsive isoform, increases exercise capacity and peak oxygen uptake.PLoS One. 2011;6(12):e28290. doi: 10.1371/journal.pone.0028290. Epub 2011 Dec 8. PLoS One. 2011. PMID: 22174785 Free PMC article.
-
PGC-1alpha regulation by exercise training and its influences on muscle function and insulin sensitivity.Am J Physiol Endocrinol Metab. 2010 Aug;299(2):E145-61. doi: 10.1152/ajpendo.00755.2009. Epub 2010 Apr 6. Am J Physiol Endocrinol Metab. 2010. PMID: 20371735 Free PMC article. Review.
-
PGC-1alpha-mediated adaptations in skeletal muscle.Pflugers Arch. 2010 Jun;460(1):153-62. doi: 10.1007/s00424-010-0834-0. Epub 2010 Apr 19. Pflugers Arch. 2010. PMID: 20401754 Review.
Cited by
-
Effects of aging and exercise training on mitochondrial function and apoptosis in the rat heart.Pflugers Arch. 2020 Feb;472(2):179-193. doi: 10.1007/s00424-020-02357-6. Epub 2020 Feb 11. Pflugers Arch. 2020. PMID: 32048000
-
Exercise, exerkines, and cardiometabolic health: from individual players to a team sport.J Clin Invest. 2023 Jun 1;133(11):e168121. doi: 10.1172/JCI168121. J Clin Invest. 2023. PMID: 37259917 Free PMC article. Review.
-
Treadmill Exercise Relieves Chronic Restraint Stress-induced Cognitive Impairments in Mice Via Activating Protein Phosphatase 2A.Neurosci Bull. 2021 Oct;37(10):1487-1492. doi: 10.1007/s12264-021-00766-w. Epub 2021 Aug 26. Neurosci Bull. 2021. PMID: 34436753 Free PMC article. No abstract available.
-
Insulin receptor substrate 1, but not IRS2, plays a dominant role in regulating pancreatic alpha cell function in mice.J Biol Chem. 2021 Jan-Jun;296:100646. doi: 10.1016/j.jbc.2021.100646. Epub 2021 Apr 9. J Biol Chem. 2021. PMID: 33839150 Free PMC article.
-
New Molecular Insights of Insulin in Diabetic Cardiomyopathy.Front Physiol. 2016 Apr 12;7:125. doi: 10.3389/fphys.2016.00125. eCollection 2016. Front Physiol. 2016. PMID: 27148064 Free PMC article. Review.
References
-
- Belke DD, Betuing S, Tuttle MJ, Graveleau C, Young ME, Pham M, Zhang D, Cooksey RC, McClain DA, Litwin SE, Taegtmeyer H, Severson D, Kahn CR, Abel ED. 2002. Insulin signaling coordinately regulates cardiac size, metabolism, and contractile protein isoform expression. J. Clin. Invest. 109:629–639. 10.1172/JCI13946 - DOI - PMC - PubMed
Publication types
MeSH terms
Substances
Grants and funding
- K99 HL111322/HL/NHLBI NIH HHS/United States
- R01 DK092065/DK/NIDDK NIH HHS/United States
- R01HL070070/HL/NHLBI NIH HHS/United States
- P30 DK079626/DK/NIDDK NIH HHS/United States
- R01 HL108379/HL/NHLBI NIH HHS/United States
- R01DK092065/DK/NIDDK NIH HHS/United States
- U01 HL087947/HL/NHLBI NIH HHS/United States
- R01HL108379/HL/NHLBI NIH HHS/United States
- R00 HL111322/HL/NHLBI NIH HHS/United States
- R01 HL070070/HL/NHLBI NIH HHS/United States
- T32 HL007576/HL/NHLBI NIH HHS/United States
- UO1HL087947/HL/NHLBI NIH HHS/United States
LinkOut - more resources
Full Text Sources
Other Literature Sources
Molecular Biology Databases
Miscellaneous