

Akt-dependent metabolic reprogramming regulates tumor cell histone acetylation
- PMID: 24998913
- PMCID: PMC4151270
- DOI: 10.1016/j.cmet.2014.06.004
Akt-dependent metabolic reprogramming regulates tumor cell histone acetylation
Abstract
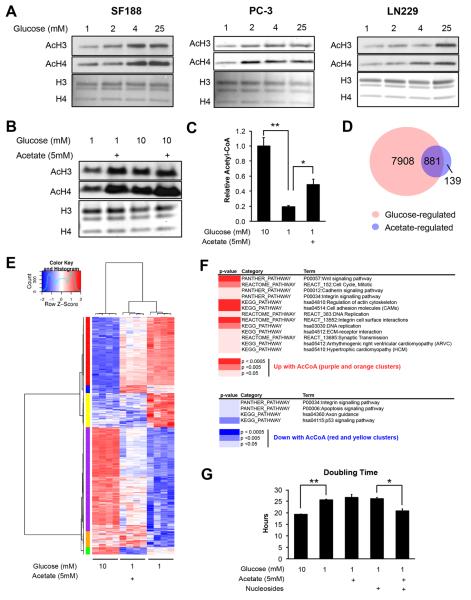
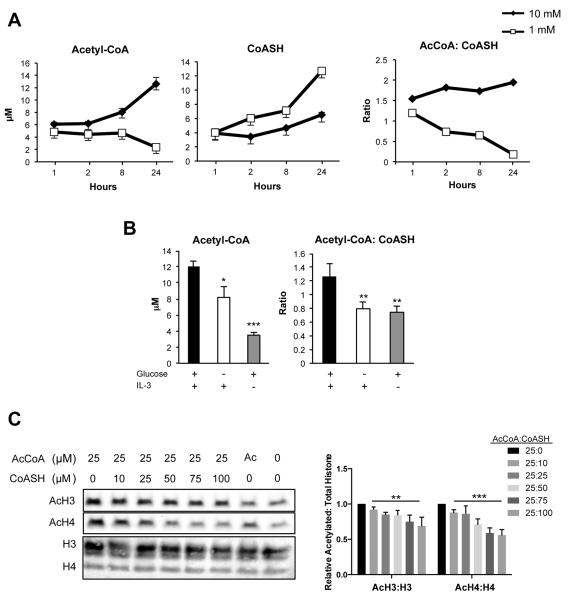
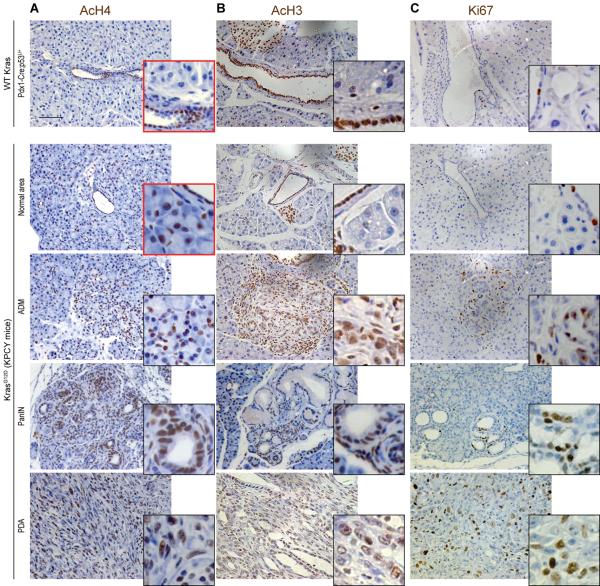
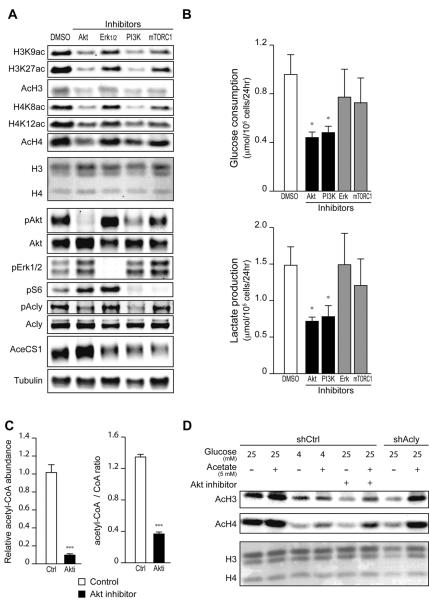
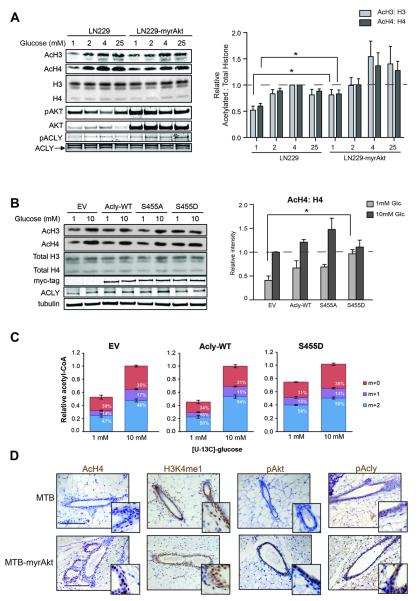
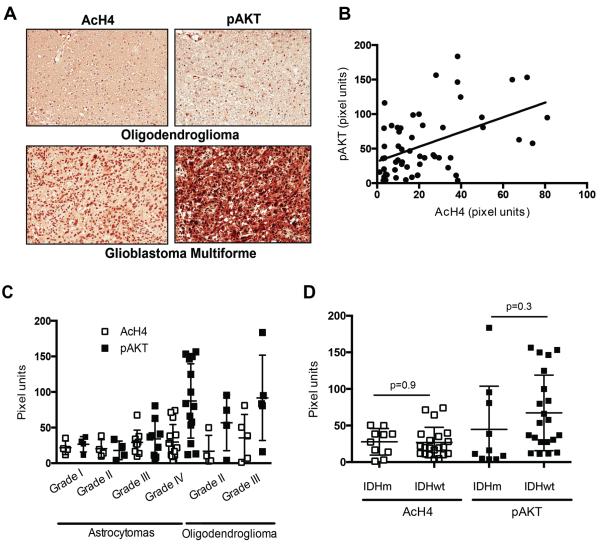
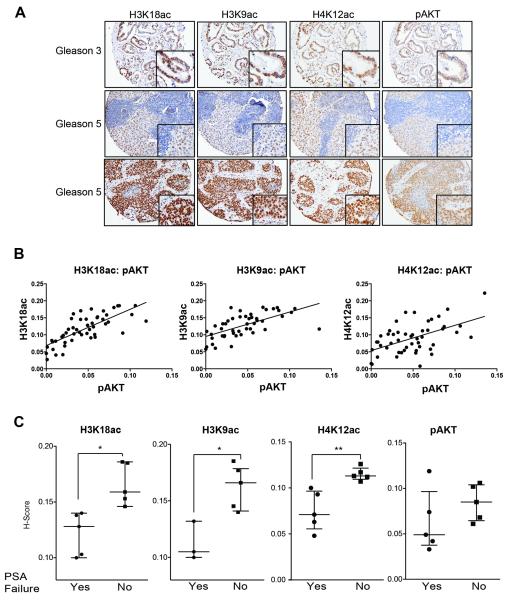
Histone acetylation plays important roles in gene regulation, DNA replication, and the response to DNA damage, and it is frequently deregulated in tumors. We postulated that tumor cell histone acetylation levels are determined in part by changes in acetyl coenzyme A (acetyl-CoA) availability mediated by oncogenic metabolic reprogramming. Here, we demonstrate that acetyl-CoA is dynamically regulated by glucose availability in cancer cells and that the ratio of acetyl-CoA:coenzyme A within the nucleus modulates global histone acetylation levels. In vivo, expression of oncogenic Kras or Akt stimulates histone acetylation changes that precede tumor development. Furthermore, we show that Akt's effects on histone acetylation are mediated through the metabolic enzyme ATP-citrate lyase and that pAkt(Ser473) levels correlate significantly with histone acetylation marks in human gliomas and prostate tumors. The data implicate acetyl-CoA metabolism as a key determinant of histone acetylation levels in cancer cells.
Copyright © 2014 Elsevier Inc. All rights reserved.
Figures
Similar articles
-
Mammalian SIRT6 Represses Invasive Cancer Cell Phenotypes through ATP Citrate Lyase (ACLY)-Dependent Histone Acetylation.Genes (Basel). 2021 Sep 21;12(9):1460. doi: 10.3390/genes12091460. Genes (Basel). 2021. PMID: 34573442 Free PMC article.
-
ATP-citrate lyase links cellular metabolism to histone acetylation.Science. 2009 May 22;324(5930):1076-80. doi: 10.1126/science.1164097. Science. 2009. PMID: 19461003 Free PMC article.
-
Integrated Analysis of Acetyl-CoA and Histone Modification via Mass Spectrometry to Investigate Metabolically Driven Acetylation.Methods Mol Biol. 2019;1928:125-147. doi: 10.1007/978-1-4939-9027-6_9. Methods Mol Biol. 2019. PMID: 30725455 Free PMC article.
-
Acetyl-CoA regulates lipid metabolism and histone acetylation modification in cancer.Biochim Biophys Acta Rev Cancer. 2023 Jan;1878(1):188837. doi: 10.1016/j.bbcan.2022.188837. Epub 2022 Nov 17. Biochim Biophys Acta Rev Cancer. 2023. PMID: 36403921 Review.
-
Exploring the Role of ATP-Citrate Lyase in the Immune System.Front Immunol. 2021 Feb 18;12:632526. doi: 10.3389/fimmu.2021.632526. eCollection 2021. Front Immunol. 2021. PMID: 33679780 Free PMC article. Review.
Cited by
-
Protein Lysine Acetylation in Ovarian Granulosa Cells Affects Metabolic Homeostasis and Clinical Presentations of Women With Polycystic Ovary Syndrome.Front Cell Dev Biol. 2020 Sep 11;8:567028. doi: 10.3389/fcell.2020.567028. eCollection 2020. Front Cell Dev Biol. 2020. PMID: 33043000 Free PMC article.
-
PI3K/Akt/mTOR Signaling Pathway in Blood Malignancies-New Therapeutic Possibilities.Cancers (Basel). 2023 Nov 5;15(21):5297. doi: 10.3390/cancers15215297. Cancers (Basel). 2023. PMID: 37958470 Free PMC article. Review.
-
Reprogramming Carbohydrate Metabolism in Cancer and Its Role in Regulating the Tumor Microenvironment.Subcell Biochem. 2022;100:3-65. doi: 10.1007/978-3-031-07634-3_1. Subcell Biochem. 2022. PMID: 36301490 Free PMC article.
-
Metabolic interactions with cancer epigenetics.Mol Aspects Med. 2017 Apr;54:50-57. doi: 10.1016/j.mam.2016.09.001. Epub 2016 Sep 9. Mol Aspects Med. 2017. PMID: 27620316 Free PMC article. Review.
-
Cancer-associated fibroblast-derived acetate promotes pancreatic cancer development by altering polyamine metabolism via the ACSS2-SP1-SAT1 axis.Nat Cell Biol. 2024 Apr;26(4):613-627. doi: 10.1038/s41556-024-01372-4. Epub 2024 Mar 1. Nat Cell Biol. 2024. PMID: 38429478 Free PMC article.
References
-
- Bauer DE, Hatzivassiliou G, Zhao F, Andreadis C, Thompson CB. ATP citrate lyase is an important component of cell growth and transformation. Oncogene. 2005;24:6314–6322. - PubMed
Publication types
MeSH terms
Substances
Associated data
- Actions
Grants and funding
- K08 CA181475/CA/NCI NIH HHS/United States
- R21 DK098769/DK/NIDDK NIH HHS/United States
- P30-DK19525/DK/NIDDK NIH HHS/United States
- P30 ES013508/ES/NIEHS NIH HHS/United States
- T32ES019851/ES/NIEHS NIH HHS/United States
- T32 ES019851/ES/NIEHS NIH HHS/United States
- P30 DK019525/DK/NIDDK NIH HHS/United States
- R21-DK098769/DK/NIDDK NIH HHS/United States
- DP2OD007447/OD/NIH HHS/United States
- R01 CA174761/CA/NCI NIH HHS/United States
- P30ES0138328/ES/NIEHS NIH HHS/United States
- DP2 OD007447/OD/NIH HHS/United States
- P30 CA016520/CA/NCI NIH HHS/United States
LinkOut - more resources
Full Text Sources
Other Literature Sources
Molecular Biology Databases
Research Materials
Miscellaneous