

Exposure to bisphenol-A during pregnancy partially mimics the effects of a high-fat diet altering glucose homeostasis and gene expression in adult male mice
- PMID: 24959901
- PMCID: PMC4069068
- DOI: 10.1371/journal.pone.0100214
Exposure to bisphenol-A during pregnancy partially mimics the effects of a high-fat diet altering glucose homeostasis and gene expression in adult male mice
Abstract
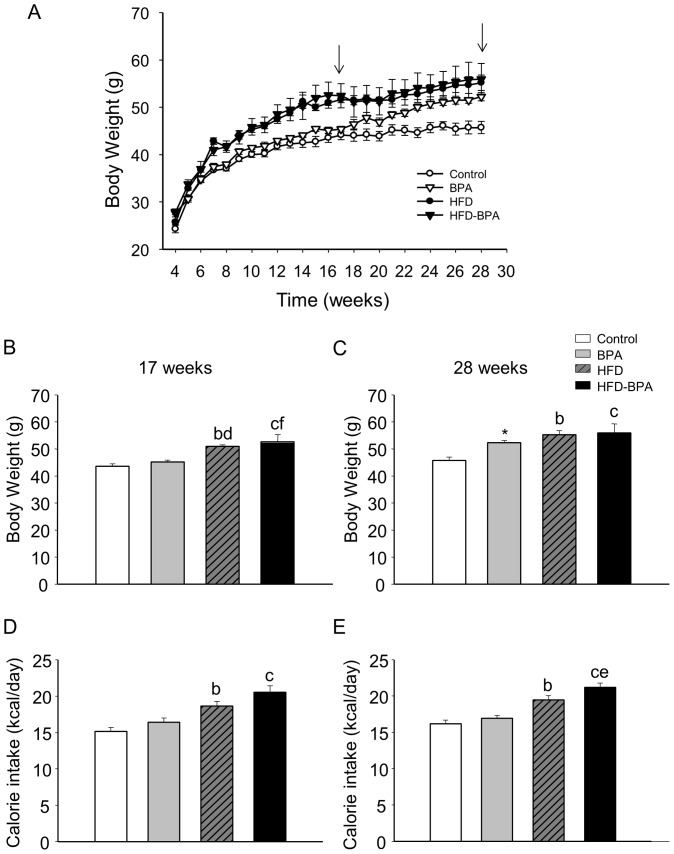
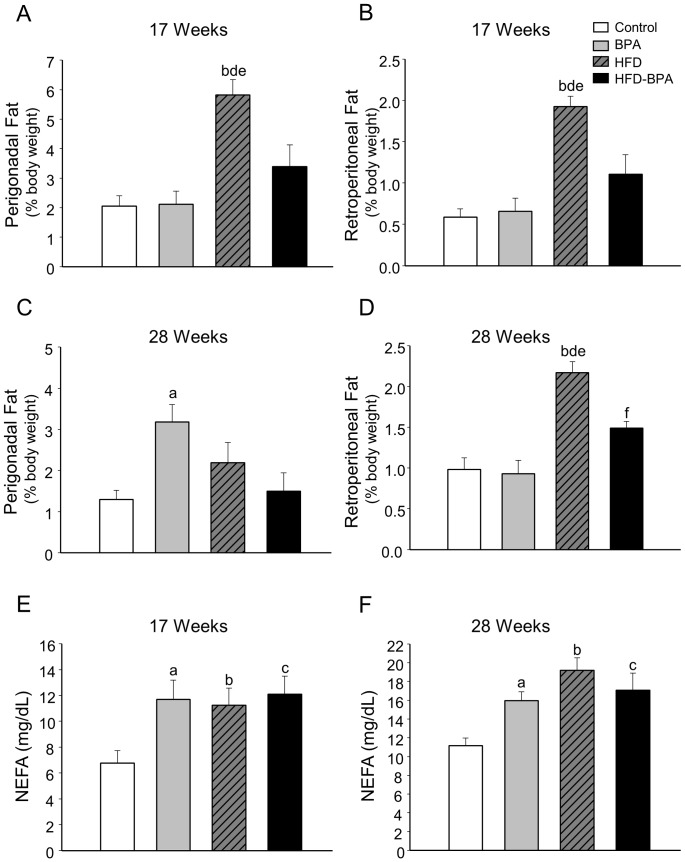
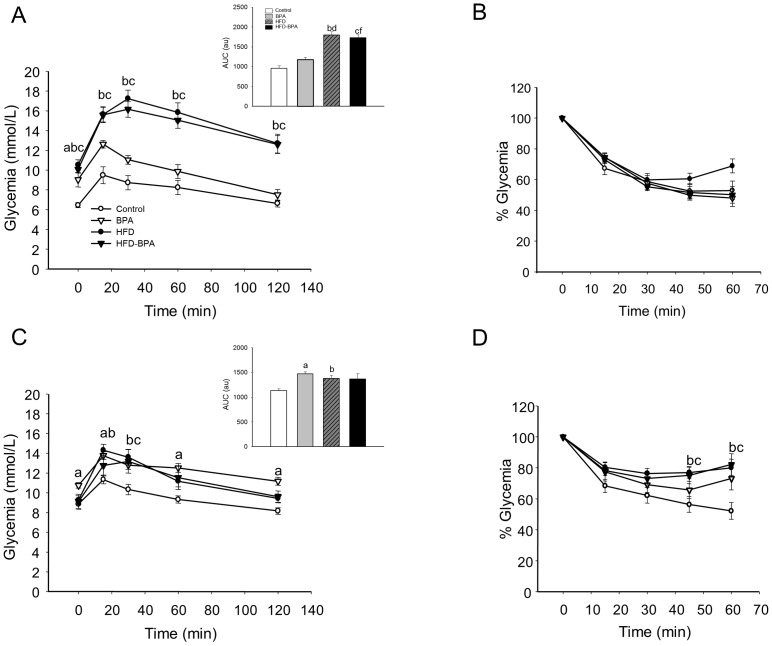
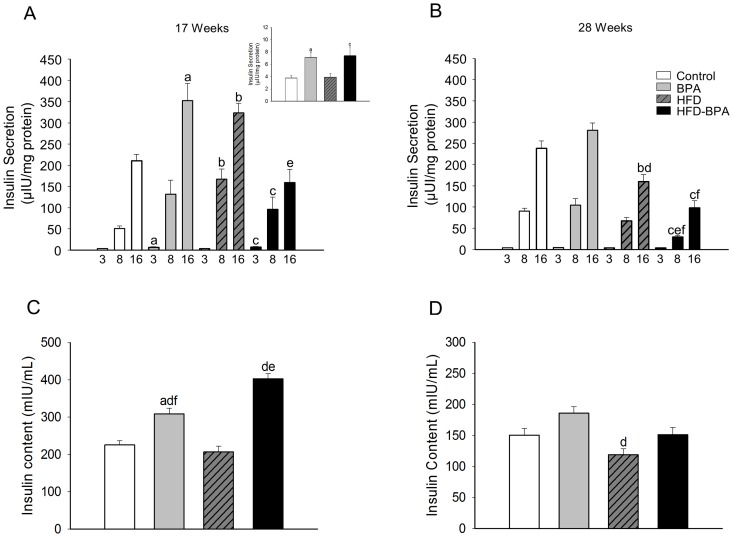
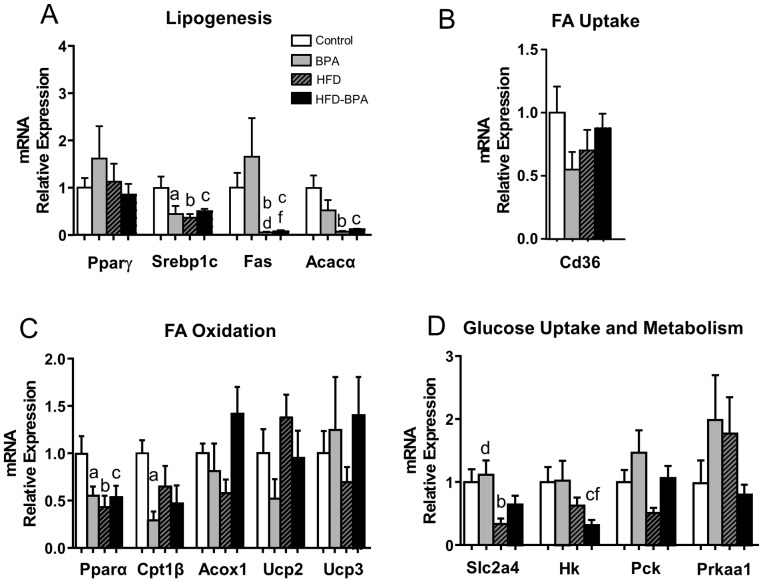
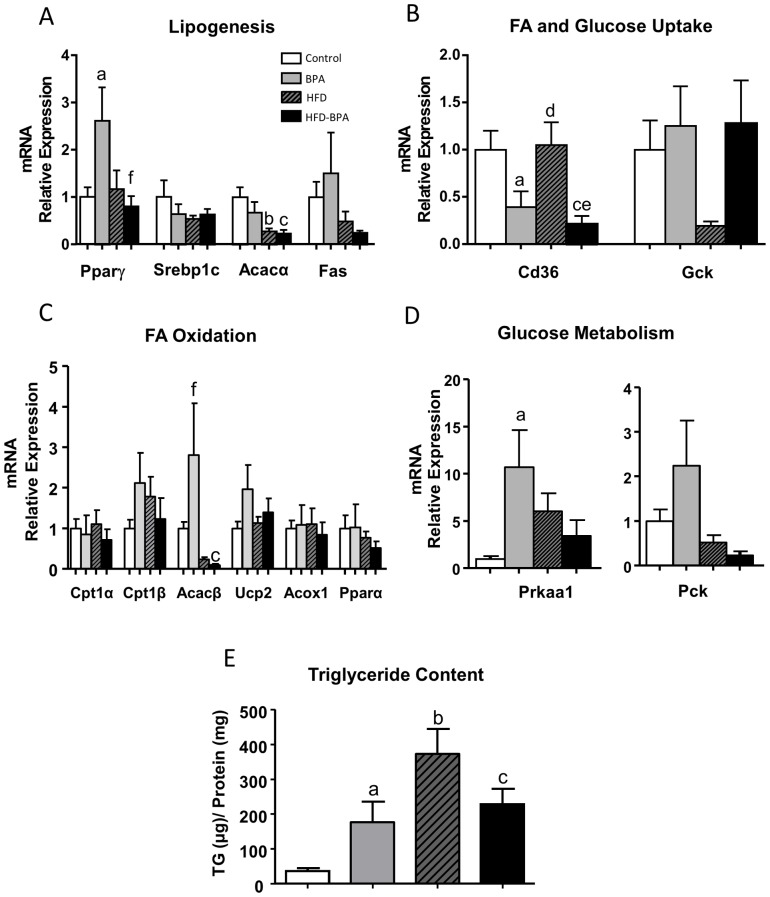
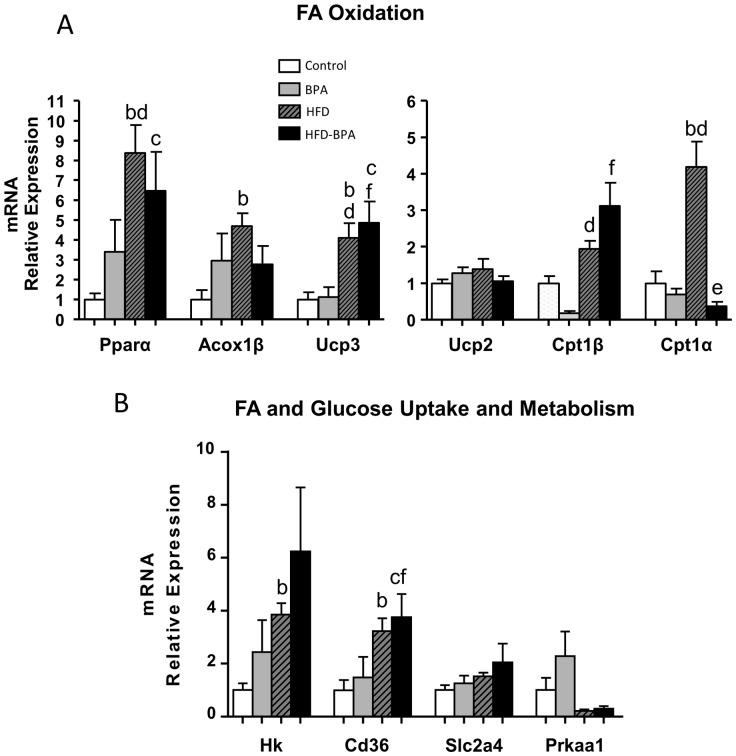
Bisphenol-A (BPA) is one of the most widespread EDCs used as a base compound in the manufacture of polycarbonate plastics. The aim of our research has been to study how the exposure to BPA during pregnancy affects weight, glucose homeostasis, pancreatic β-cell function and gene expression in the major peripheral organs that control energy flux: white adipose tissue (WAT), the liver and skeletal muscle, in male offspring 17 and 28 weeks old. Pregnant mice were treated with a subcutaneous injection of 10 µg/kg/day of BPA or a vehicle from day 9 to 16 of pregnancy. One month old offspring were divided into four different groups: vehicle treated mice that ate a normal chow diet (Control group); BPA treated mice that also ate a normal chow diet (BPA); vehicle treated animals that had a high fat diet (HFD) and BPA treated animals that were fed HFD (HFD-BPA). The BPA group started to gain weight at 18 weeks old and caught up to the HFD group before week 28. The BPA group as well as the HFD and HFD-BPA ones presented fasting hyperglycemia, glucose intolerance and high levels of non-esterified fatty acids (NEFA) in plasma compared with the Control one. Glucose stimulated insulin release was disrupted, particularly in the HFD-BPA group. In WAT, the mRNA expression of the genes involved in fatty acid metabolism, Srebpc1, Pparα and Cpt1β was decreased by BPA to the same extent as with the HFD treatment. BPA treatment upregulated Pparγ and Prkaa1 genes in the liver; yet it diminished the expression of Cd36. Hepatic triglyceride levels were increased in all groups compared to control. In conclusion, male offspring from BPA-treated mothers presented symptoms of diabesity. This term refers to a form of diabetes which typically develops in later life and is associated with obesity.
Conflict of interest statement
Figures
Similar articles
-
Long-term oral exposure to bisphenol A induces glucose intolerance and insulin resistance.J Endocrinol. 2015 Jul;226(1):35-42. doi: 10.1530/JOE-14-0714. Epub 2015 May 13. J Endocrinol. 2015. PMID: 25972359
-
Perinatal bisphenol A exposure and adult glucose homeostasis: identifying critical windows of exposure.PLoS One. 2013 May 10;8(5):e64143. doi: 10.1371/journal.pone.0064143. Print 2013. PLoS One. 2013. PMID: 23675523 Free PMC article.
-
Bisphenol-A treatment during pregnancy in mice: a new window of susceptibility for the development of diabetes in mothers later in life.Endocrinology. 2015 May;156(5):1659-70. doi: 10.1210/en.2014-1952. Epub 2015 Apr 1. Endocrinology. 2015. PMID: 25830705
-
Bisphenol A and Type 2 Diabetes Mellitus: A Review of Epidemiologic, Functional, and Early Life Factors.Int J Environ Res Public Health. 2021 Jan 15;18(2):716. doi: 10.3390/ijerph18020716. Int J Environ Res Public Health. 2021. PMID: 33467592 Free PMC article. Review.
-
Influence of Bisphenol A on Type 2 Diabetes Mellitus.Int J Environ Res Public Health. 2016 Oct 6;13(10):989. doi: 10.3390/ijerph13100989. Int J Environ Res Public Health. 2016. PMID: 27782064 Free PMC article. Review.
Cited by
-
Ventricular Fibrosis and Coronary Remodeling Following Short-Term Exposure of Healthy and Malnourished Mice to Bisphenol A.Front Physiol. 2021 Apr 12;12:638506. doi: 10.3389/fphys.2021.638506. eCollection 2021. Front Physiol. 2021. PMID: 33912069 Free PMC article.
-
Thyroid stimulating hormone stimulates the expression of glucose transporter 2 via its receptor in pancreatic β cell line, INS-1 cells.Sci Rep. 2018 Jan 31;8(1):1986. doi: 10.1038/s41598-018-20449-3. Sci Rep. 2018. PMID: 29386586 Free PMC article.
-
Differential effects on adiposity and serum marker of bone formation by post-weaning exposure to methylparaben and butylparaben.Environ Sci Pollut Res Int. 2016 Nov;23(21):21957-21968. doi: 10.1007/s11356-016-7452-0. Epub 2016 Aug 18. Environ Sci Pollut Res Int. 2016. PMID: 27535158
-
Prenatal Bisphenol A Exposure in Mice Induces Multitissue Multiomics Disruptions Linking to Cardiometabolic Disorders.Endocrinology. 2019 Feb 1;160(2):409-429. doi: 10.1210/en.2018-00817. Endocrinology. 2019. PMID: 30566610 Free PMC article.
-
Bisphenol a: A narrative review of prenatal exposure effects on adipogenesis and childhood obesity via peroxisome proliferator-activated receptor gamma.Environ Res. 2019 Jun;173:54-68. doi: 10.1016/j.envres.2019.03.012. Epub 2019 Mar 6. Environ Res. 2019. PMID: 30897403 Free PMC article. Review.
References
-
- Welshons WV, Nagel SC, vom Saal FS (2006) Large effects from small exposures. III. Endocrine mechanisms mediating effects of bisphenol A at levels of human exposure. Endocrinology 147: S56–69. - PubMed
-
- Vandenberg LN, Hauser R, Marcus M, Olea N, Welshons WV (2007) Human exposure to bisphenol A (BPA). Reprod Toxicol 24: 139–177. - PubMed
-
- Wetherill YB, Akingbemi BT, Kanno J, McLachlan JA, Nadal A, et al. (2007) In vitro molecular mechanisms of bisphenol A action. Reprod Toxicol 24: 178–198. - PubMed
Publication types
MeSH terms
Substances
Grants and funding
LinkOut - more resources
Full Text Sources
Other Literature Sources
Research Materials
