. 2014 Jul;55(7):1357-65.
doi: 10.1194/jlr.M049148. Epub 2014 May 27.

Lipidomics identifies a requirement for peroxisomal function during influenza virus replication

Affiliations

Lipidomics identifies a requirement for peroxisomal function during influenza virus replication

Lukas Bahati Tanner et al. J Lipid Res. 2014 Jul.

Abstract

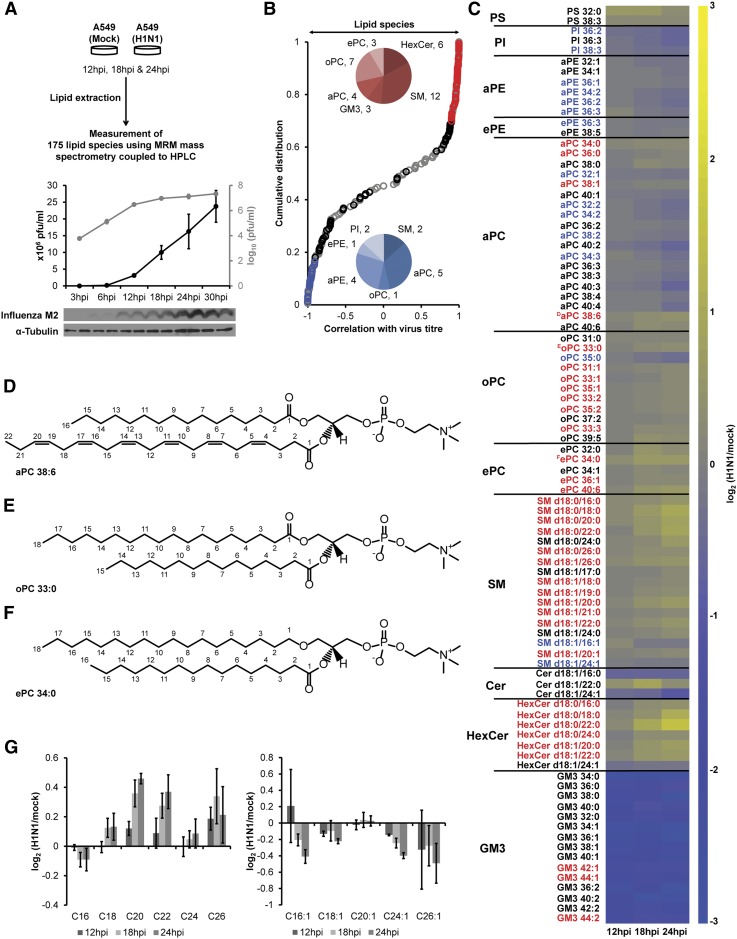
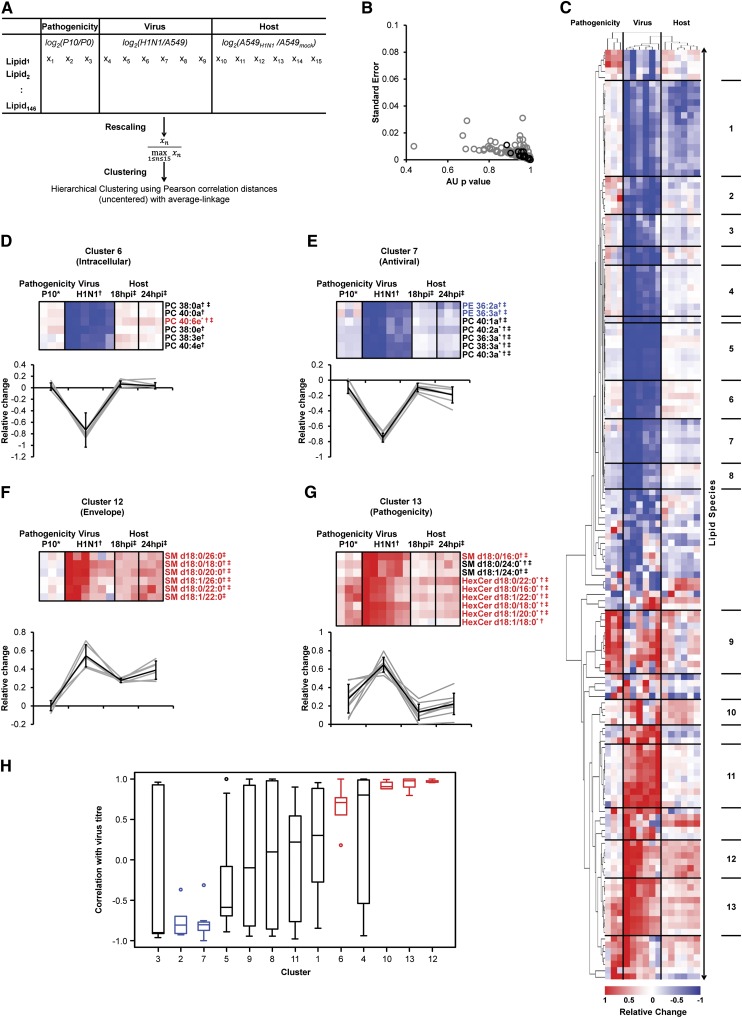
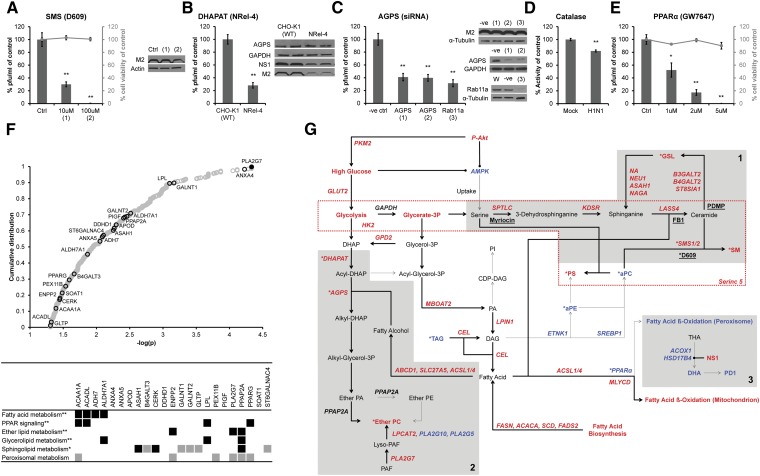
Influenza virus acquires a host-derived lipid envelope during budding, yet a convergent view on the role of host lipid metabolism during infection is lacking. Using a mass spectrometry-based lipidomics approach, we provide a systems-scale perspective on membrane lipid dynamics of infected human lung epithelial cells and purified influenza virions. We reveal enrichment of the minor peroxisome-derived ether-linked phosphatidylcholines relative to bulk ester-linked phosphatidylcholines in virions as a unique pathogenicity-dependent signature for influenza not found in other enveloped viruses. Strikingly, pharmacological and genetic interference with peroxisomal and ether lipid metabolism impaired influenza virus production. Further integration of our lipidomics results with published genomics and proteomics data corroborated altered peroxisomal lipid metabolism as a hallmark of influenza virus infection in vitro and in vivo. Influenza virus may therefore tailor peroxisomal and particularly ether lipid metabolism for efficient replication.

Keywords: biochemistry; ether lipids; glycerophospholipids; lipid metabolism; sphingolipids; systems biology.


Figures

Fig. 1.
Fig. 1.
Influenza virus infection impacts peroxisomal and sphingolipid metabolism in the host. A: A549 cells were infected with purified influenza virus. 175 lipid species were analyzed by mass spectrometry at 12, 18, and 24 hpi. B: Distribution of Pearson correlation coefficients between 175 lipid species and virus titer (supplementary Tables I, II). Black, red (>0.9) and blue (>−0.9) indicate 90 lipid species altered in influenza virus-infected cells (q < 0.006; supplementary Table II). C: Heatplot showing fold ratios (infected/mock) of 90 lipid species with altered levels upon infection (q < 0.006). Yellow and blue indicate elevated and decreased concentrations, respectively. Lipid species, which correlate with virus titer (B), are indicated by red (>0.9) and blue (<−0.9) fonts. Representative structures to illustrate the differences between ester-linked (D), odd chain (E), and ether-linked (F) PC lipids. Please note that we were able to determine the total carbon fatty acyl composition but did not dissect the exact carbon composition of the two fatty acyl constituents in the measured GPL species. Hence, the two fatty acyl constituents shown in the structures can vary as long as they add up to the respective total carbon fatty acyl compositions. G: Fold ratios of changes in fatty acid chain length composition of Cer, HexCer, and SM lipid species. Results in panels A, B, C, and G are from three independent experiments with three replicates each (n = 9 for each condition). Error bars in G represent ± SDs.
Fig. 2.
Fig. 2.
Peroxisome-dependent remodelling of PC lipids is specific for influenza virus. A: 159 lipid species from purified A549-grown influenza virions were analyzed by mass spectrometry. Virus purity was assessed by SDS-PAGE and Coomassie blue staining. Virus proteins were identified based on their size. B: Lipid composition of influenza virions (dark gray bars) compared with mock-infected A549 cells at 12 h postinfection (hpi) (light gray bars) (supplementary Table III). Error bars represent ± SDs calculated from three independent experiments (n = 9 for mock-infected A549 cells at 12 hpi) and two independent experiments (n = 6 for purified influenza virions); *P < 0.05, **P < 0.005, and ***P < 0.0005 (unpaired Student’s t-test; two-tailed). C: Ether PC to ester PC (ePC/aPC) ratios of influenza virions (circles) compared with (D) ePC/aPC ratios of other enveloped viruses (diamonds) in relation to uninfected producer cells (bars) (supplementary Table IV); **P < 0.002 (unpaired Student’s t-test; two-tailed). E: Differences in ePC/aPC ratios between P0 and P10 H3N2 strains (supplemetary Fig. III, supplementary Table V). Results are from three independent experiments with two replicates (n = 6); * P < 0.02 (paired Student’s t-test; two-tailed). F: Differences in ePC/aPC ratios in virus versus host membranes (ΔVirus-Cell) of influenza (circles) and other viruses (diamonds) as described for D and E.
Fig. 3.
Fig. 3.
Life cycle-dependent clusters of lipids revealed by comparative analysis of host and viral lipid profiles. A: Hierarchical clustering was performed on 146 lipid species describing pathogenicity-related differences in lipid composition, influenza virus-enriched lipids, and alterations in host cell lipid metabolism. Values were rescaled to make different data sets comparable for cluster analysis (see Methods for details). B: Approximately unbiased (AU) p-values and standard errors (bootstrap resampling; n = 10,000) of tree splits (gray circles) and 13 assigned clusters (black circles). C: Dendrogram indicating increased (red) and decreased (blue) levels of individual lipid species (supplementary Table VI). D–G: Average changes in lipid species (gray lines) and average relative trends (black line ± SDs) for intracellular (D), antiviral (E), envelope-enriched (F) and pathogenicity-dependent (G) clusters. Correlations of individual lipid species with virus titer is indicated by red (>0.9) and blue (<0.9) fonts, respectively; * altered in a pathogenicity-dependent fashion; enriched in H1N1; alterations in infected cells as determined in Figs. 1 and 2. H: Correlation of the 13 clusters with virus titer. Medians are depicted with Q1, Q3, and 1.5*inter-quartile range (IQR). Robust correlations are colored in blue (negative) and red (positive).
Fig. 4.
Fig. 4.
Functional requirements of ether- and sphingolipid metabolism. A: The sphingomyelin synthase (SMS) inhibitor D609 impaired late stages of virus replication (supplementary Fig. IV). Results are shown from three independent experiments with four replicates each (n = 12 for all conditions). B: Impaired virus replication in ether lipid-deficient CHO (NRel-4) cells compared with wild-type cells (CHO-K1) (supplementary Fig. V). Results are from three independent experiments with four replicates each (n = 12 for CHO-K1 and NRel-4 cells). C: Knockdown of AGPS (1 and 2 denote different probes) reduced virus production similar to Rab11a depletion (3) (supplementary Fig. VI). Results are from at least three independent experiments with two to four replicates each (n = 19 for negative control (-ve); n = 16 for AGPS (1); n = 19 for AGPS (2); n = 8 for Rab11a). D: Catalase activity was reduced 20% in virus-infected cells (n = 6 from two independent experiments with three replicates each). E: Induction of peroxisomal β-oxidation by a PPARα agonist (GW7647) inhibited virus production. Results are from three independent experiments with four to six replicates each. [n = 14 for DMSO control (Ctrl), GW7647 (1 µM) and GW7647 (2 µM)] and from one experiment with six replicates [n = 6 for GW7647 (5 µM)]. For A–E, virus titer was determined by plaque assay and represented as % of control ± SEMs; *P < 0.005 and **P < 0.0005 (unpaired Student’s t-test; two-tailed). Expression of proteins was determined by Western blot (one representative blot is shown), using antibodies against AGPS, Rab11a, GAPDH, and α-tubulin (positive controls), and influenza virus NS1 and M2. F: Distribution of host (mouse) susceptibility factors to influenza virus infection (39): lipid-associated genes (black circles), independently identified genes (40) (filled black circles), such as PLA2G7, the most significantly associated factor; remaining genes (open gray circles). Lipid-associated genes were manually annotated to Kyoto Encyclopedia of Genes and Genomes (KEGG) pathways (gray squares) or by Database for Annotation, Visualization and Integrated Discovery (DAVID) (black squares; * P < 0.05 (EASE score, a modified Fisher Exact P-value) and ** P < 0.05 [EASE score; Benjamini corrected)]. G: Proposed lipid metabolism in influenza virus-infected cells based on combined lipidomics data (this study) with genomics and proteomics results (supplementary Table VII). Genes, proteins, and metabolites are depicted in bold red (proviral or increased), bold blue (antiviral or decreased) and bold black (pro- or antiviral activity not determined) fonts. Fluxes proposed to be increased (bold arrows) or decreased (dashed arrows), inhibitory interactions (round ended bold lines), chemical inhibitors (underlined bold black) and the membrane scaffold of Serinc5 (dashed red box) are also shown. Gray boxes indicate sphingolipid (1), ether lipid (2) and peroxisomal β-oxidation (3) metabolic pathways; *identified in this study.

Similar articles

Cited by

References

    1. Brass A. L., Huang I. C., Benita Y., John S. P., Krishnan M. N., Feeley E. M., Ryan B. J., Weyer J. L., van der Weyden L., Fikrig E., et al. 2009. The IFITM proteins mediate cellular resistance to influenza A H1N1 virus, West Nile virus, and dengue virus. Cell. 139: 1243–1254 - PMC - PubMed
    1. Hao L., Sakurai A., Watanabe T., Sorensen E., Nidom C. A., Newton M. A., Ahlquist P., Kawaoka Y. 2008. Drosophila RNAi screen identifies host genes important for influenza virus replication. Nature. 454: 890–893 - PMC - PubMed
    1. Karlas A., Machuy N., Shin Y., Pleissner K. P., Artarini A., Heuer D., Becker D., Khalil H., Ogilvie L. A., Hess S., et al. 2010. Genome-wide RNAi screen identifies human host factors crucial for influenza virus replication. Nature. 463: 818–822 - PubMed
    1. König R., Stertz S., Zhou Y., Inoue A., Hoffmann H. H., Bhattacharyya S., Alamares J. G., Tscherne D. M., Ortigoza M. B., Liang Y., et al. 2010. Human host factors required for influenza virus replication. Nature. 463: 813–817 - PMC - PubMed
    1. Shapira S. D., Gat-Viks I., Shum B. O., Dricot A., de Grace M. M., Wu L., Gupta P. B., Hao T., Silver S. J., Root D. E., et al. 2009. A physical and regulatory map of host-influenza interactions reveals pathways in H1N1 infection. Cell. 139: 1255–1267 - PMC - PubMed

Publication types

Substances

LinkOut - more resources