Osterix marks distinct waves of primitive and definitive stromal progenitors during bone marrow development
- PMID: 24823377
- PMCID: PMC4051418
- DOI: 10.1016/j.devcel.2014.03.013
Osterix marks distinct waves of primitive and definitive stromal progenitors during bone marrow development
Abstract
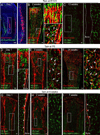
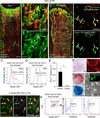
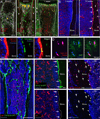
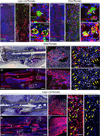
Mesenchymal stem and progenitor cells (MSPCs) contribute to bone marrow (BM) homeostasis by generating multiple types of stromal cells. MSPCs can be labeled in the adult BM by Nestin-GFP, whereas committed osteoblast progenitors are marked by Osterix expression. However, the developmental origin and hierarchical relationship of stromal cells remain largely unknown. Here, by using a lineage-tracing system, we describe three distinct waves of contributions of Osterix(+) cells in the BM. First, Osterix(+) progenitors in the fetal BM contribute to nascent bone tissues and transient stromal cells that are replaced in the adult marrow. Second, Osterix-expressing cells perinatally contribute to osteolineages and long-lived BM stroma, which have characteristics of Nestin-GFP(+) MSPCs. Third, Osterix labeling in the adult marrow is osteolineage-restricted, devoid of stromal contribution. These results uncover a broad expression profile of Osterix and raise the intriguing possibility that distinct waves of stromal cells, primitive and definitive, may organize the developing BM.
Copyright © 2014 Elsevier Inc. All rights reserved.
Figures


Similar articles
-
TGF-β Signaling Plays an Essential Role in the Lineage Specification of Mesenchymal Stem/Progenitor Cells in Fetal Bone Marrow.Stem Cell Reports. 2019 Jul 9;13(1):48-60. doi: 10.1016/j.stemcr.2019.05.017. Epub 2019 Jun 13. Stem Cell Reports. 2019. PMID: 31204302 Free PMC article.
-
Osterix-cre labeled progenitor cells contribute to the formation and maintenance of the bone marrow stroma.PLoS One. 2013 Aug 8;8(8):e71318. doi: 10.1371/journal.pone.0071318. eCollection 2013. PLoS One. 2013. PMID: 23951132 Free PMC article.
-
Imbalanced Osteogenesis and Adipogenesis in Mice Deficient in the Chemokine Cxcl12/Sdf1 in the Bone Mesenchymal Stem/Progenitor Cells.J Bone Miner Res. 2018 Apr;33(4):679-690. doi: 10.1002/jbmr.3340. Epub 2018 Jan 3. J Bone Miner Res. 2018. PMID: 29120093
-
Plasticity and regulation of human bone marrow stromal osteoprogenitor cells: potential implication in the treatment of age-related bone loss.Histol Histopathol. 2004 Jan;19(1):151-7. doi: 10.14670/HH-19.151. Histol Histopathol. 2004. PMID: 14702183 Review.
-
Bone marrow mesenchymal stem cells: fat on and blast off by FGF21.Int J Biochem Cell Biol. 2013 Mar;45(3):546-9. doi: 10.1016/j.biocel.2012.12.014. Epub 2012 Dec 25. Int J Biochem Cell Biol. 2013. PMID: 23270727 Free PMC article. Review.
Cited by
-
Hdac3 Deficiency Increases Marrow Adiposity and Induces Lipid Storage and Glucocorticoid Metabolism in Osteochondroprogenitor Cells.J Bone Miner Res. 2016 Jan;31(1):116-28. doi: 10.1002/jbmr.2602. Epub 2015 Aug 20. J Bone Miner Res. 2016. PMID: 26211746 Free PMC article.
-
Antenatal endogenous and exogenous glucocorticoids and their impact on immune ontogeny and long-term immunity.Semin Immunopathol. 2016 Nov;38(6):739-763. doi: 10.1007/s00281-016-0575-z. Epub 2016 Jul 28. Semin Immunopathol. 2016. PMID: 27465226 Review.
-
Bone and the regulation of global energy balance.J Intern Med. 2015 Jun;277(6):681-9. doi: 10.1111/joim.12348. J Intern Med. 2015. PMID: 25597336 Free PMC article. Review.
-
Murine Bone Marrow Niches from Hematopoietic Stem Cells to B Cells.Int J Mol Sci. 2018 Aug 10;19(8):2353. doi: 10.3390/ijms19082353. Int J Mol Sci. 2018. PMID: 30103411 Free PMC article. Review.
-
Integrin alpha11 is an Osteolectin receptor and is required for the maintenance of adult skeletal bone mass.Elife. 2019 Jan 11;8:e42274. doi: 10.7554/eLife.42274. Elife. 2019. PMID: 30632962 Free PMC article.
References
-
- Arai F, Hirao A, Ohmura M, Sato H, Matsuoka S, Takubo K, Ito K, Koh GY, Suda T. Tie2/angiopoietin-1 signaling regulates hematopoietic stem cell quiescence in the bone marrow niche. Cell. 2004;118:149–161. - PubMed
-
- Bryon PA, Gentilhomme O, Fiere D. Histomorphometric analysis of bone-marrow adipose density and heterogeneity in myeloid aplasia and dysplasia (author's transl) Pathol Biol (Paris) 1979;27:209–213. - PubMed
-
- Calvi LM, Adams GB, Weibrecht KW, Weber JM, Olson DP, Knight MC, Martin RP, Schipani E, Divieti P, Bringhurst FR, et al. Osteoblastic cells regulate the haematopoietic stem cell niche. Nature. 2003;425:841–846. - PubMed
Publication types
MeSH terms
Substances
Grants and funding
- R00 DE022564/DE/NIDCR NIH HHS/United States
- K99 DE022564/DE/NIDCR NIH HHS/United States
- R01 HL069438/HL/NHLBI NIH HHS/United States
- T32 GM062754/GM/NIGMS NIH HHS/United States
- P01 DK056246/DK/NIDDK NIH HHS/United States
- DE022564/DE/NIDCR NIH HHS/United States
- R01 HL116340/HL/NHLBI NIH HHS/United States
- HL069438/HL/NHLBI NIH HHS/United States
- DK056638/DK/NIDDK NIH HHS/United States
- R01 HL097819/HL/NHLBI NIH HHS/United States
- P30 CA013330/CA/NCI NIH HHS/United States
- R01 DK056638/DK/NIDDK NIH HHS/United States
- DK056246/DK/NIDDK NIH HHS/United States
LinkOut - more resources
Full Text Sources
Other Literature Sources
Molecular Biology Databases

