

Polarization of the effects of autoimmune and neurodegenerative risk alleles in leukocytes
- PMID: 24786080
- PMCID: PMC4910825
- DOI: 10.1126/science.1249547
Polarization of the effects of autoimmune and neurodegenerative risk alleles in leukocytes
Abstract
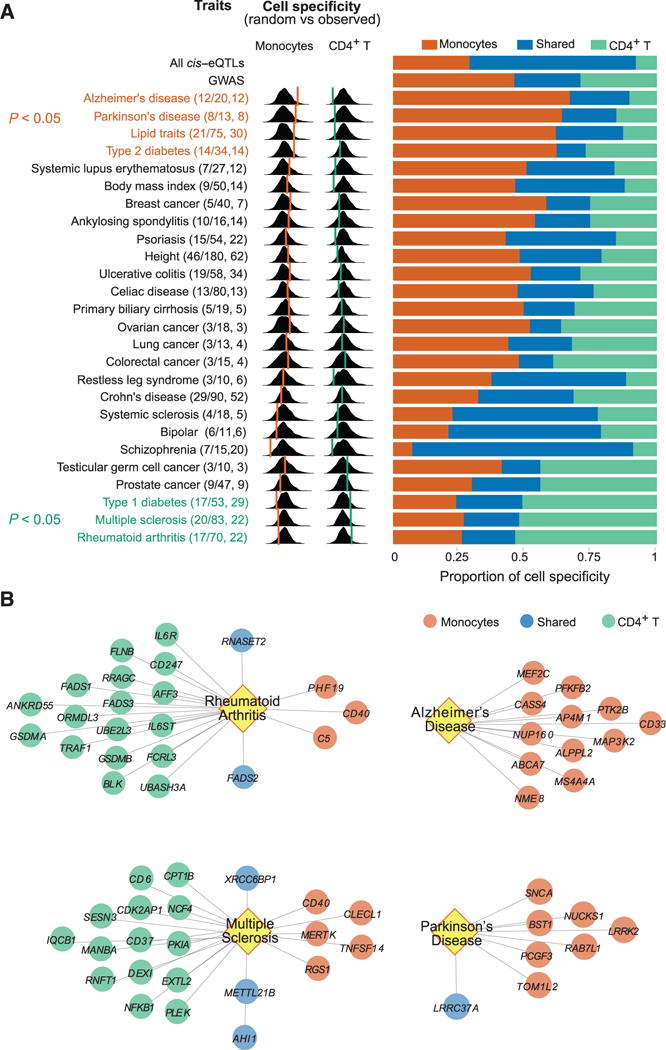
To extend our understanding of the genetic basis of human immune function and dysfunction, we performed an expression quantitative trait locus (eQTL) study of purified CD4(+) T cells and monocytes, representing adaptive and innate immunity, in a multi-ethnic cohort of 461 healthy individuals. Context-specific cis- and trans-eQTLs were identified, and cross-population mapping allowed, in some cases, putative functional assignment of candidate causal regulatory variants for disease-associated loci. We note an over-representation of T cell-specific eQTLs among susceptibility alleles for autoimmune diseases and of monocyte-specific eQTLs among Alzheimer's and Parkinson's disease variants. This polarization implicates specific immune cell types in these diseases and points to the need to identify the cell-autonomous effects of disease susceptibility variants.
Figures
Comment in
-
Monocytes and Parkinson's disease: invaders from outside?Mov Disord. 2014 Sep;29(10):1242. doi: 10.1002/mds.25993. Epub 2014 Aug 14. Mov Disord. 2014. PMID: 25124371 No abstract available.
Similar articles
-
Monocytes and Parkinson's disease: invaders from outside?Mov Disord. 2014 Sep;29(10):1242. doi: 10.1002/mds.25993. Epub 2014 Aug 14. Mov Disord. 2014. PMID: 25124371 No abstract available.
-
Tensor decomposition of stimulated monocyte and macrophage gene expression profiles identifies neurodegenerative disease-specific trans-eQTLs.PLoS Genet. 2020 Feb 3;16(2):e1008549. doi: 10.1371/journal.pgen.1008549. eCollection 2020 Feb. PLoS Genet. 2020. PMID: 32012164 Free PMC article.
-
Regulation of gene expression in autoimmune disease loci and the genetic basis of proliferation in CD4+ effector memory T cells.PLoS Genet. 2014 Jun 26;10(6):e1004404. doi: 10.1371/journal.pgen.1004404. eCollection 2014 Jun. PLoS Genet. 2014. PMID: 24968232 Free PMC article.
-
Autoimmune diseases - connecting risk alleles with molecular traits of the immune system.Nat Rev Genet. 2016 Mar;17(3):160-74. doi: 10.1038/nrg.2015.33. Epub 2016 Feb 15. Nat Rev Genet. 2016. PMID: 26907721 Free PMC article. Review.
-
Innate and adaptive immune abnormalities underlying autoimmune diseases: the genetic connections.Sci China Life Sci. 2023 Jul;66(7):1482-1517. doi: 10.1007/s11427-021-2187-3. Epub 2023 Feb 3. Sci China Life Sci. 2023. PMID: 36738430 Free PMC article. Review.
Cited by
-
Exploiting Gene-Expression Deconvolution to Probe the Genetics of the Immune System.PLoS Comput Biol. 2016 Apr 1;12(4):e1004856. doi: 10.1371/journal.pcbi.1004856. eCollection 2016 Apr. PLoS Comput Biol. 2016. PMID: 27035464 Free PMC article.
-
A genetic study on C5-TRAF1 and progression of joint damage in rheumatoid arthritis.Arthritis Res Ther. 2015 Jan 8;17(1):1. doi: 10.1186/s13075-014-0514-0. Arthritis Res Ther. 2015. PMID: 25566937 Free PMC article.
-
Characterization of candidate genes in inflammatory bowel disease-associated risk loci.JCI Insight. 2016 Aug 18;1(13):e87899. doi: 10.1172/jci.insight.87899. JCI Insight. 2016. PMID: 27668286 Free PMC article.
-
TAM receptor signaling in immune homeostasis.Annu Rev Immunol. 2015;33:355-91. doi: 10.1146/annurev-immunol-032414-112103. Epub 2015 Jan 14. Annu Rev Immunol. 2015. PMID: 25594431 Free PMC article. Review.
-
Host and Environmental Factors Influencing Individual Human Cytokine Responses.Cell. 2016 Nov 3;167(4):1111-1124.e13. doi: 10.1016/j.cell.2016.10.018. Cell. 2016. PMID: 27814508 Free PMC article.
References
Publication types
MeSH terms
Associated data
- Actions
Grants and funding
LinkOut - more resources
Full Text Sources
Other Literature Sources
Medical
Molecular Biology Databases
Research Materials
