. 2014 Jul;88(13):7331-44.
doi: 10.1128/JVI.00596-14. Epub 2014 Apr 16.

Kaposi's sarcoma-associated herpesvirus-encoded LANA interacts with host KAP1 to facilitate establishment of viral latency

Affiliations

Kaposi's sarcoma-associated herpesvirus-encoded LANA interacts with host KAP1 to facilitate establishment of viral latency

Rui Sun et al. J Virol. 2014 Jul.

Abstract

Kaposi's sarcoma-associated herpesvirus (KSHV) typically displays two different phases in its life cycle, the default latent phase and the lytic phase. There is a short period of lytic gene expression in the early stage of KSHV primary infection. The factors involved in the shutdown process of lytic gene expression are poorly identified. It has been shown that the latency-associated nuclear antigen (LANA) encoded by KSHV plays an important role in the establishment of viral latency. In screening, we identified a host protein, Krüppel-associated box domain-associated protein 1 (KAP1), that bound to LANA. We validated the interaction between LANA and KAP1 in vivo and in vitro, as well as their colocalization in the nucleus. We mapped out that LANA interacted with both the N- and C-terminal domains of KAP1. Based on the interface of LANA-KAP1 interaction determined, we proved that LANA recruited KAP1 to the RTA promoter region of the KSHV genome. We revealed that KAP1 was involved in transcriptional repression by LANA. We found multiple cooccupation sites of LANA and KAP1 on the whole KSHV genome by chromatin immunoprecipitation for sequencing (ChIP-seq) and demonstrated that LANA-recruited KAP1 played a critical role in the shutdown of lytic gene expression during the early stage of KSHV primary infection. Taken together, our data suggest that LANA interacts with KAP1 and represses lytic gene expression to facilitate the establishment of KSHV latency.

Importance: Our study revealed the mechanism of transcriptional repression by LANA during KSHV primary infection, providing new insights into the process of KSHV latency establishment.


Figures

FIG 1
FIG 1
LANA forms a complex with KAP1 in vivo and in vitro. (A) TAP. A plasmid expressing Strep-Flag-tagged LANA was transfected into HEK 293T cells. The equivalent empty vector was transfected as a control (Con). Cell lysates were subjected to affinity purification with streptavidin beads, followed by IP with Flag M2 beads. The purified eluates were resolved by SDS-PAGE and visualized by silver staining. The bands corresponding to LANA and KAP1 are indicated. (B and C) Co-IP of LANA and KAP1 in HEK 293T cells. (B) Flag-tagged KAP1 was transfected into cells, along with Strep-Flag-tagged LANA or empty-vector controls. After affinity purification with streptavidin beads, the purified proteins, along with input samples, were detected by Western blotting (WB) with anti-Flag and anti-KAP1 antibodies (Ab). (C) HA-tagged LANA was transfected into cells, along with Flag-tagged KAP1or empty-vector controls. After IP with Flag M2 beads, the purified proteins, along with input samples, were detected by Western blotting with anti-HA and anti-Flag antibodies. (D) Co-IP of endogenous LANA and KAP1 in JSC-1 cells. JSC-1 cell lysates were subjected to IP with anti-LANA (α-LANA) antibody or mouse IgG controls. Purified proteins, along with input samples, were detected by Western blotting with anti-LANA and anti-KAP1 antibodies. (E) In vitro interaction between LANA and KAP1. Purified GST, GST-fused LANA-N (aa 1 to 340), and GST-fused LANA-C (aa 1022 to 1162) beads were incubated with equivalent in vitro-translated (IVT) biotin-KAP1, and pulled-down proteins were subjected to Transcend chemiluminescent translation detection. The asterisks indicate the specific bands of IVT biotin-KAP1.
FIG 2
FIG 2
LANA colocalizes with KAP1 in the nucleus. BCBL-1 (top row) and JSC-1 (bottom row) cells were fixed and probed with mouse antibody against LANA and rabbit antibody against KAP1, followed by incubation with goat anti-mouse IgG conjugated with Alexa Fluor 488 (green) and goat anti-rabbit IgG conjugated with Alexa Fluor 555 (red). Significant colocalized dot signals are indicated by arrowheads. Magnification: oil lens, ×63; zoom, ×2. Magnified views of the boxed areas are shown in the insets.
FIG 3
FIG 3
LANA interacts with both N- and C-terminal domains of KAP1. (A) Domains of KAP1 and truncated constructs used in this study. (B) Purified GST-fused KAP1 truncated constructs for GST pulldown assay. Purified GST-fused KAP1 truncated constructs were subjected to SDS-PAGE and Coomassie blue staining. (C) GST pulldown assay. Purified GST and GST-fused KAP1 truncated constructs were incubated with equivalent cell lysates containing HA-tagged LANA, and the pulled-down proteins were subjected to Western blotting with anti-LANA antibody. (D) Co-IP of LANA and KAP1 truncated constructs in HEK 293T cells. HA-tagged KAP1 truncated constructs were transfected into HEK 293T cells, along with Strep-Flag-tagged LANA. After affinity purification with streptavidin beads, the purified proteins, along with input samples, were detected by Western blotting with anti-Flag and anti-HA antibodies. The asterisks indicate the major bands.
FIG 4
FIG 4
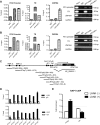
LANA recruits KAP1 to the RTA promoter region. (A and B) ChIP assays of LANA and KAP1 in BCBL-1 (A) and JSC-1 (B) cells. The immunoprecipitated DNA in the ChIP assays was subjected to qPCR (left) and DNA gel analysis (right). Binding of LANA and KAP1 at the RTA promoter and TR regions was determined using corresponding primers. The ZNF554 region was detected as a positive control for KAP1 binding. ChIP-qPCR data were normalized by the percent input method (signals obtained from ChIP were divided by signals obtained from an input sample). The data are presented as means ± standard deviations (SD). (C) Illustration of the primer sets at the RTA promoter used in the ChIP assays. (D) Binding of LANA and KAP1 at the RTA promoter region as determined by the primers shown in panel C. ChIP-qPCR data were normalized by the percent input method. (E) ChIP assays of KAP1 in the presence (+) or absence (−) of LANA expression. Plasmid pGL2-RTAp containing the RTA promoter or pGL3p-TR containing the TR fragment was transfected into cells with LANA expression plasmid or empty-vector controls. Cells were collected for ChIP assay at 36 h posttransfection. ChIP-qPCR data were normalized by the fold enrichment method (ChIP signals were divided by the IgG signals). The data are presented as means and SD.
FIG 5
FIG 5
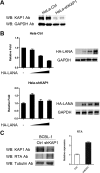
KAP1 is involved in transcriptional repression by LANA. (A) Knocked-down KAP1 in HeLa-shKAP1 cells. (B) Luciferase reporter gene assay in HeLa-Ctrl and HeLa-shKAP1 cells. pGL2-RTAp reporter plasmid (0.2 μg) was transfected into HeLa-Ctrl cells, along with 0, 0.5, 1, or 2 μg pCAGGS-HA-LANA and HeLa-shKAP1 cells and 0, 1, 2, or 4 μg pCAGGS-HA-LANA due to lower LANA expression in HeLa-shKAP1 cells. The total transfected DNA was normalized with the pCAGGS empty vector. Promoter activity is presented as the fold relative to the control (without LANA expression). The data are presented as means and SD. Multiple independent experiments were performed in triplicate. (C) Knocked-down KAP1 in BCBL-1 cells. The expression of RTA was detected by Western blotting (left) and qPCR (right).
FIG 6
FIG 6
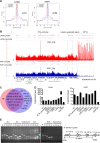
LANA and KAP1 had multiple cooccupation sites on the KSHV genome. (A) Peak models of LANA and KAP1 built by MACS based on the human genome alignment. (B) Illustration of LANA and KAP1 binding sites on the whole KSHV genome. The ChIP-seq data on LANA and KAP1 were aligned to the KSHV genome (HQ404500 plus 35 copies of the TR [U75699.1]) and subjected to peak calling with MACS (P < 10−3). The output files (peaks, summits, and wigs) were visualized in IGV software. The identified peaks are shown in the peak diagrams. The summit diagrams show the sites with the highest scores in the peaks. The wig diagrams show the general binding information for the whole KSHV genome. The region marked by the asterisk covers ∼28 kb of the KSHV genome that failed to show the enrichment signal of LANA and KAP1, due to possible deletion or large sequence variation in the KSHV genome of BC-3 cells. (C) Diagram of regions occupied by LANA (red) and KAP1 (blue) (P < 10−5). (D) Validation of ChIP-seq results by qPCR. ChIP-qPCR data were normalized by fold enrichment (ChIP signals were divided by the IgG signals). GAPDH was a negative control. The data are presented as means and SD. (E) Validation of possible deletion or large sequence variation in the KSHV genome of BC-3 cells by PCR.
FIG 7
FIG 7
LANA-recruited KAP1 is crucial for establishment of KSHV latency. (A) Illustration of de novo KSHV infection in HeLa-Ctrl and HeLa-shKAP1 cells. (B) Relative KSHV genome DNA copy numbers in cells. Cells were collected for DNA extraction at 24 h postinfection, and the relative quantity was determined by qPCR. Two primer sets were used. The data were normalized against GAPDH. The data are presented as means and SD. (C) Kinetics of lytic gene expression during primary infection. Cells were collected for RNA extraction at the indicated time points and reverse transcribed to cDNA. The relative quantity was determined by qPCR. The data were normalized against GAPDH. The data are presented as means ± SD. Shown is a representative result of de novo infection experiments. The complete de novo infection experiments were done twice independently and showed the same tendency. For some individual time points, the results were repeated at least three times. (D) ChIP assay of AcH3 at the RTA promoter region. Cells were collected for AcH3 ChIP assay at 48 h postinfection. ChIP-qPCR data were normalized by the percent input method (signals obtained from ChIP were divided by signals obtained from an input sample). The data are presented as means and SD.

Similar articles

Cited by

References

    1. Chang Y, Cesarman E, Pessin MS, Lee F, Culpepper J, Knowles DM, Moore PS. 1994. Identification of herpesvirus-like DNA sequences in AIDS-associated Kaposi's sarcoma. Science 266:1865–1869. 10.1126/science.7997879 - DOI - PubMed
    1. Cesarman E, Chang Y, Moore PS, Said JW, Knowles DM. 1995. Kaposi's sarcoma-associated herpesvirus-like DNA sequences in AIDS-related body-cavity-based lymphomas. N. Engl. J. Med. 332:1186–1191. 10.1056/NEJM199505043321802 - DOI - PubMed
    1. Soulier J, Grollet L, Oksenhendler E, Cacoub P, Cazals-Hatem D, Babinet P, d'Agay MF, Clauvel JP, Raphael M, Degos L, Sigaux F. 1995. Kaposi's sarcoma-associated herpesvirus-like DNA sequences in multicentric Castleman's disease. Blood 86:1276–1280 - PubMed
    1. Boshoff C, Chang Y. 2001. Kaposi's sarcoma-associated herpesvirus: a new DNA tumor virus. Annu. Rev. Med. 52:453–470. 10.1146/annurev.med.52.1.453 - DOI - PubMed
    1. Ye F, Lei X, Gao SJ. 2011. Mechanisms of Kaposi's sarcoma-associated herpesvirus latency and reactivation. Adv. Virol. 2011:193860. 10.1155/2011/193860 - DOI - PMC - PubMed

Publication types

MeSH terms