. 2014 Mar;124(3):1173-86.
doi: 10.1172/JCI72230. Epub 2014 Feb 17.

Extracellular caspase-6 drives murine inflammatory pain via microglial TNF-α secretion

Extracellular caspase-6 drives murine inflammatory pain via microglial TNF-α secretion

Temugin Berta et al. J Clin Invest. 2014 Mar.

Abstract

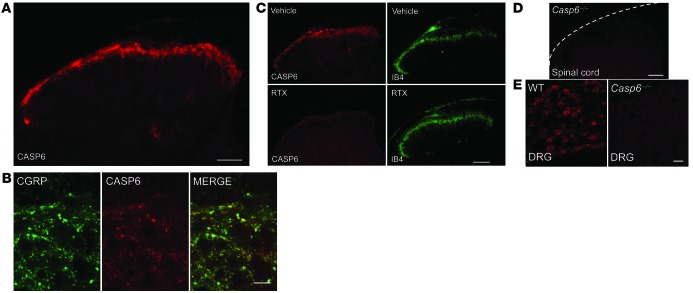
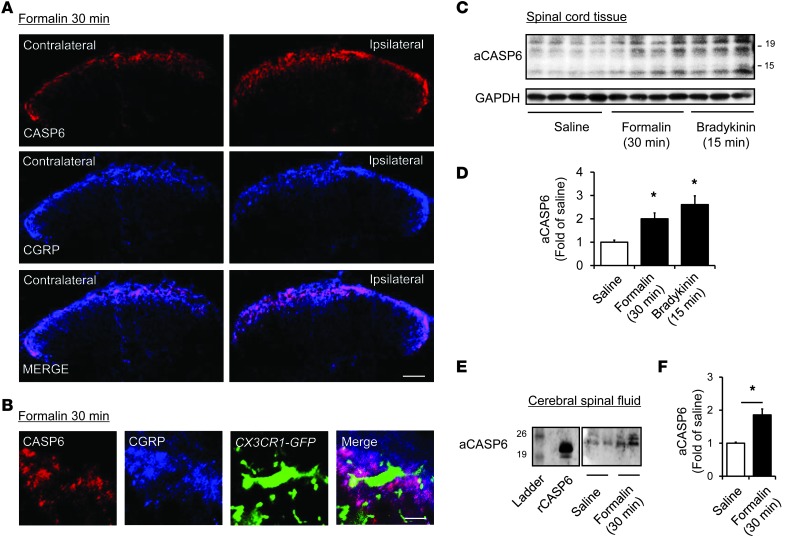
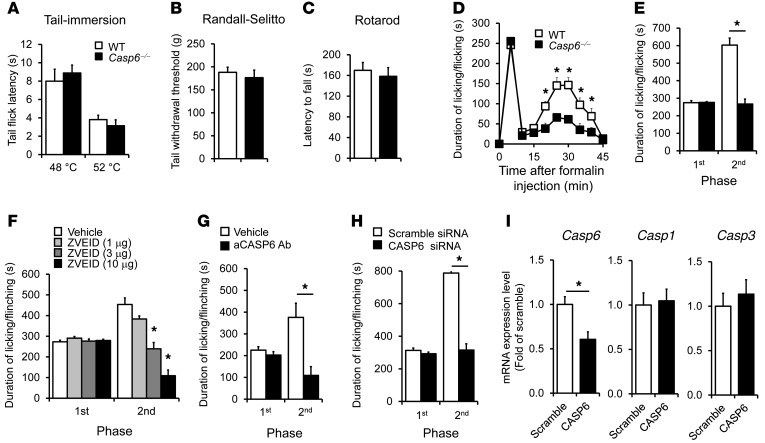
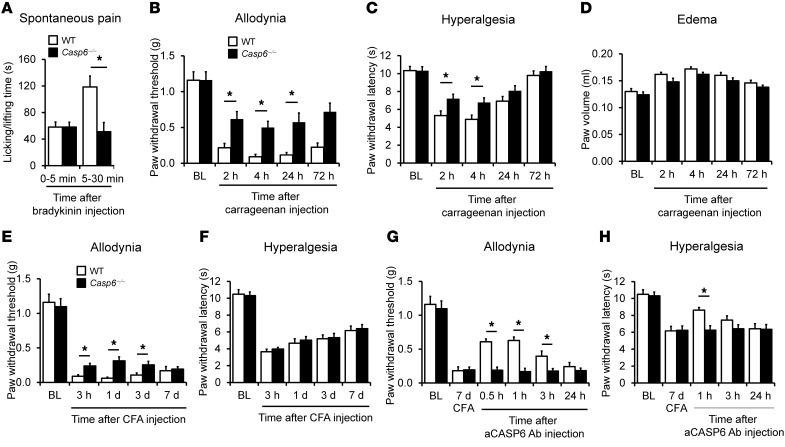
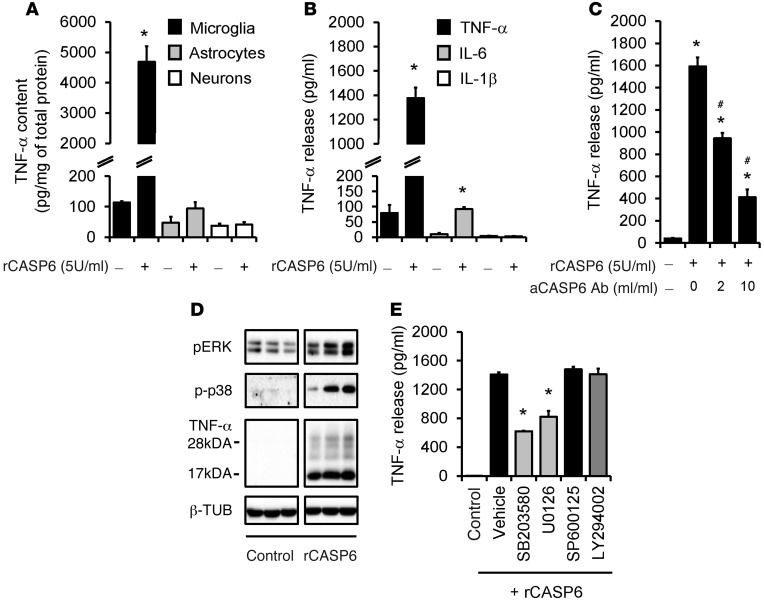
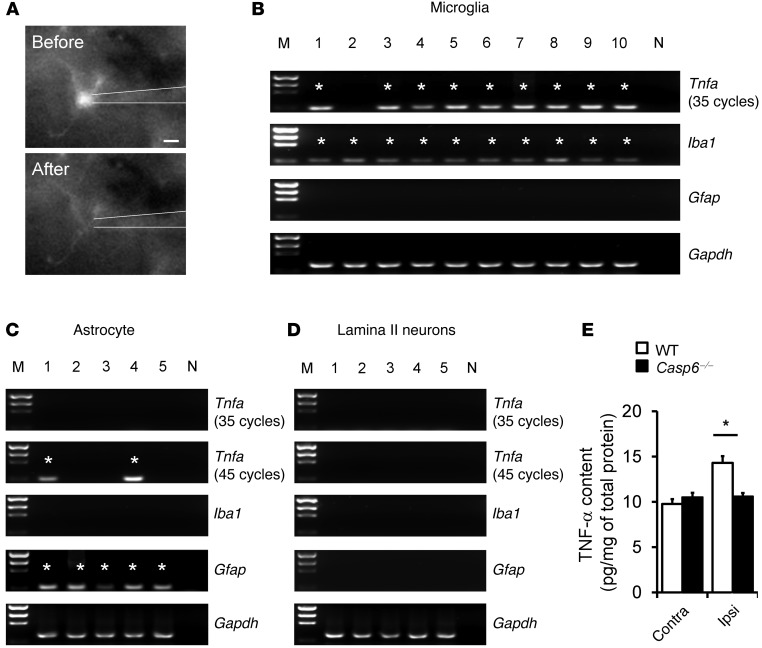
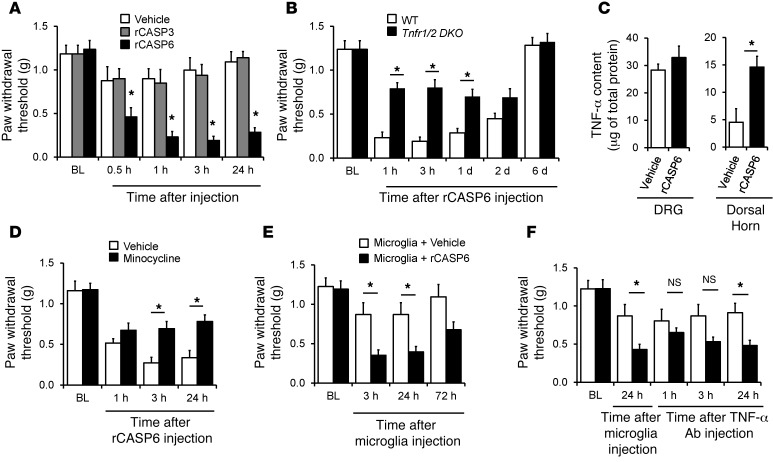
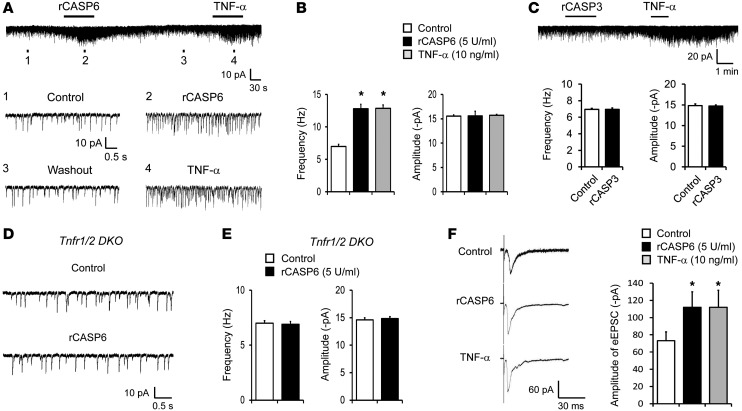
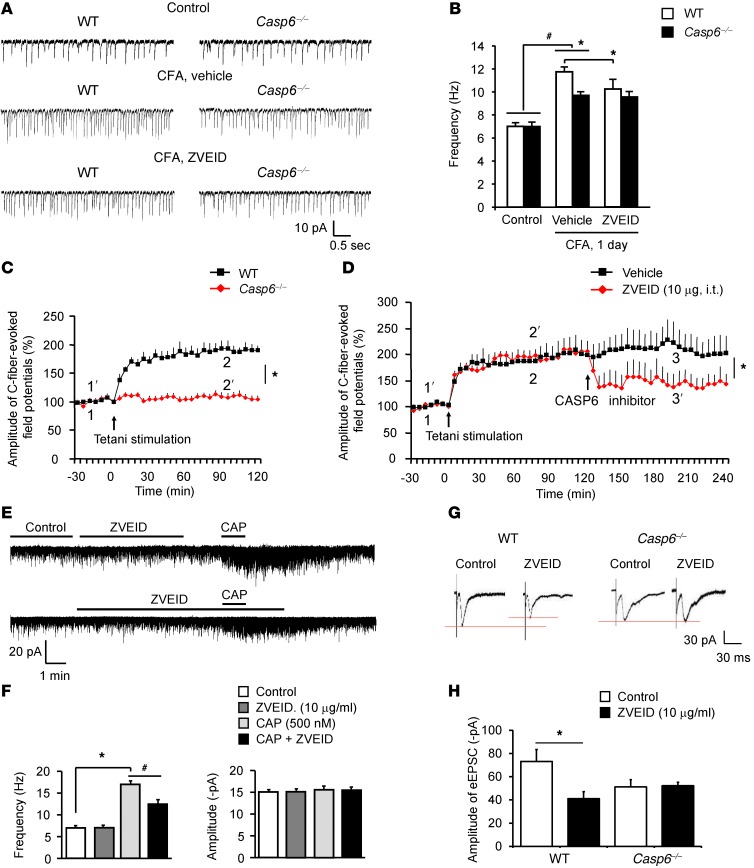
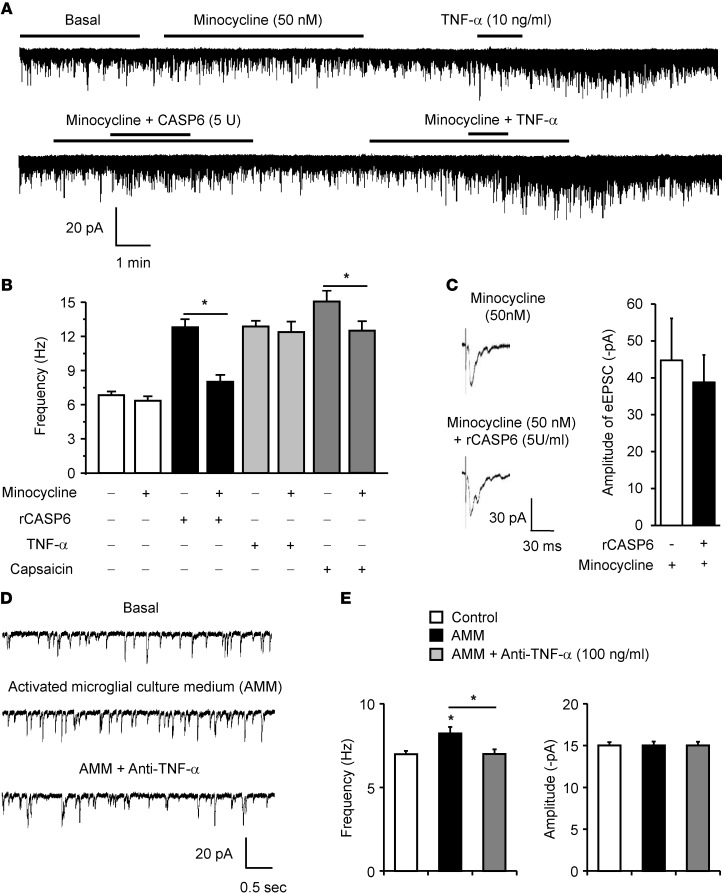
Increasing evidence indicates that the pathogenesis of neuropathic pain is mediated through spinal cord microglia activation. The intracellular protease caspase-6 (CASP6) is known to regulate neuronal apoptosis and axonal degeneration; however, the contribution of microglia and CASP6 in modulating synaptic transmission and pain is unclear. Here, we found that CASP6 is expressed specifically in C-fiber axonal terminals in the superficial spinal cord dorsal horn. Animals exposed to intraplantar formalin or bradykinin injection exhibited CASP6 activation in the dorsal horn. Casp6-null mice had normal baseline pain, but impaired inflammatory pain responses. Furthermore, formalin-induced second-phase pain was suppressed by spinal injection of CASP6 inhibitor or CASP6-neutralizing antibody, as well as perisciatic nerve injection of CASP6 siRNA. Recombinant CASP6 (rCASP6) induced marked TNF-α release in microglial cultures, and most microglia within the spinal cord expressed Tnfa. Spinal injection of rCASP6 elicited TNF-α production and microglia-dependent pain hypersensitivity. Evaluation of excitatory postsynaptic currents (EPSCs) revealed that rCASP6 rapidly increased synaptic transmission in spinal cord slices via TNF-α release. Interestingly, the microglial inhibitor minocycline suppressed rCASP6 but not TNF-α-induced synaptic potentiation. Finally, rCASP6-activated microglial culture medium increased EPSCs in spinal cord slices via TNF-α. Together, these data suggest that CASP6 released from axonal terminals regulates microglial TNF-α secretion, synaptic plasticity, and inflammatory pain.


Figures

Figure 1
Figure 1. Localization of CASP6 in central terminals of primary afferents in the superficial dorsal horn of the spinal cord.
(A) CASP6 immunoreactivity in the spinal cord dorsal horn. Scale bar: 100 μm. (B) Confocal images of double immunofluorescence showing colocalization of CASP6 and CGRP in axonal terminals of the superficial dorsal horn. Scale bar: 20 μm. (C) Ablation of the TRPV1-expressing primary afferents with RTX (10 mg/kg, i.p., daily for 3 days) abolishes CASP6 immunostaining but not IB4 staining in the superficial dorsal horn. Scale bar: 100 μm. (D) Absence of CASP6 immunostaining in the dorsal horn of Casp6–/– mice. Scale bar: 100 μm. (E) CASP6 immunostaining in DRGs of WT and Casp6–/– mice. Scale bar: 50 μm.
Figure 2
Figure 2. Upregulation of CASP6 in the spinal cord and CSF after acute inflammation.
(A) Double staining of CASP6 and CGRP in the ipsilateral and contralateral dorsal horn 30 minutes after formalin injection. Scale bar: 100 μm. (B) Triple staining of CASP6, CGRP, and CX3CR1 (GFP) in the ipsilateral dorsal horn 30 minutes after formalin injection. Note close contacts between CASP/CGRP-expressing axonal terminals and microglial cell body and processes. Scale bar: 10 μm. (C and D) Western blot analysis showing the bands of active CASP6 (aCASP6, ≈20 and 10 kDa) 30 minutes after the formalin (5%) injection and 15 minutes after bradykinin (300 ng) injection. (D) Intensity of aCASP6 bands. *P < 0.05, n = 3–4 mice. (E and F) Western blotting analysis showing increase of aCASP6 in the CSF. The positive control band of rCASP6 is indicated. (F) Intensity of aCASP6 bands. *P < 0.05, n = 5 rats.
Figure 3
Figure 3. Formalin-induced second-phase inflammatory pain is reduced after deletion of Casp6, spinal inhibition of CASP6 with inhibitor or neutralizing antibody, or DRG knockdown of Casp6 with specific siRNA.
(AC) Casp6–/– mice exhibit normal thermal pain (A, tail immersion test), mechanical pain (B, Randall-Selitto test), and motor function (C, rotarod test). n = 6 mice. (D) Time course (0–45 minutes) of formalin-induced spontaneous pain in WT and Casp6–/– mice. *P < 0.05, compared with WT mice, n = 6–8 mice. (E) Formalin-induced first-phase (1–10 minutes) and second-phase nociceptive responses (10–45 minutes) in WT and Casp6–/– mice. *P < 0.05, n = 6–8 mice. (F) Spinal injection of the CASP6 inhibitor ZVEID (i.t., 1–10 μg) reduces the second-phase pain. *P < 0.05, compared with vehicle (10% DMSO), n = 5–6 mice. (G) Spinal injection of CASP6-neutralizing antibody (i.t., 1 μg) reduces the second-phase pain. *P < 0.05, n = 5–7 mice. (H and I) Perisciatic delivery of Casp6 siRNA (2 μg, 6 μl, mixed with the RVG peptide) suppresses the formalin-induced second-phase pain (H) and reduces the expression of Casp6 but not Casp1 and Casp3 in DRGs (I). Scramble siRNA served as control siRNA. *P < 0.05, n = 5–8 mice.
Figure 4
Figure 4. CASP6 contributes to the development of inflammatory pain induced by intraplantar bradykinin, carrageenan, and CFA.
(A) Bradykinin-induced spontaneous pain in the second phase (5–30 minutes), but not the first phase (0–5 minutes), is reduced in Casp6–/– mice. *P < 0.05, n = 7–8 mice. (B and C) Carrageenan-induced mechanical allodynia (B) and heat hyperalgesia (C) are reduced in Casp6–/– mice. *P < 0.05, compared with WT mice, n = 5 mice. (D) Carrageenan-induced paw edema (measured as paw volume) is unaltered in Casp6–/– mice; n = 5 mice. (E and F) CFA-induced mechanical allodynia (E) but not heat hyperalgesia (F) is partially and transiently reduced in Casp6–/– mice. *P < 0.05, compared with WT mice, n = 5 mice. (G and H) Reversal of CFA-induced mechanical allodynia and heat hyperalgesia by CASP6-neutralizing antibody (1 μg, i.t.) in WT mice. *P < 0.05, n = 5 mice. Note that the CASP6 antibody does not affect inflammatory pain in Casp6–/– mice.
Figure 5
Figure 5. rCASP6 induces TNF-α release in microglial cultures via MAPK activation.
(A) TNF-α expression, revealed by ELISA analysis, in primary cultures of microglia, astrocytes, and DRG neurons after stimulation of rCASP6 (5 U/ml, 3 hours). *P < 0.05, n = 4 cultures. (B) Release of TNF-α, IL-1β, and IL-6 (ELISA analysis) in microglial culture medium after stimulation of rCASP6 (5 U/ml, 3 hours). *P < 0.05, compared with control, n = 4 cultures. (C) Dose-dependent inhibition of rCASP6-induced (5 U/ml, 3 hours) TNF-α release by CASP6-neutralizing antibody in microglial cultures. *P < 0.05, compared with control; #P < 0.05; compared with rCASP6, n = 3 cultures. (D) Expression of pERK, p-p38, and TNF-α, revealed by Western blot analysis, in microglial cultures after rCASP6 (5 U/ml, 3 hours) treatment. All the bands are from the same gel (Supplemental Figure 6E). Note a robust increase in the secreted form of TNF-α (17 kDa). (E) Effects of the MAPK inhibitor SB203580, U0126, and SP600125 (50 μM) and the PI3K inhibitor LY294002 (50 μM) on rCASP6-induced TNF-α release in microglial cultures. *P < 0.05, compared with vehicle (1% DMSO), n = 4 cultures.
Figure 6
Figure 6. Tnfa is expressed in spinal microglia and upregulated after inflammation.
(A) A microglial cell is sucked into a glass pipette. Scale bar: 5 μm. (BD) Single-cell PCR analysis showing the expression of Tnfa, Iba1, and Gfap in 10 microglia, 5 astrocytes, and 5 neurons in lamina II of spinal cord slices. Note that 90% of microglia express Tnfa, and all microglia express Iba1 but not Gfap. Asterisks indicate positive bands. M, markers for DNA sizes; N, negative control; Gapdh, positive control. The cDNAs were amplified for 40 and 35 cycles in the first- and second-round PCR, respectively. The Tnfa cDNAs from astrocytes and neurons were amplified further for an additional 10 cycles (45 cycles in total) in the second-round PCR. (E) ELISA analysis showing TNF-α levels in the ipsilateral (Ipsi) and contralateral (Contra) dorsal horn of WT and Casp6–/– mice 30 minutes after the formalin injection. *P < 0.05, n = 6 mice.
Figure 7
Figure 7. Intrathecal injection of rCASP6 induces mechanical allodynia via microglial and TNF-α signaling.
(A) Intrathecal rCASP6 but not rCASP3 (5 U) elicits persistent mechanical allodynia. *P < 0.05 versus vehicle (PBS), n = 6–8 mice. (B) rCASP6-induced (i.t., 5 U) mechanical allodynia is abrogated in Tnfr double knockout (Tnfr1/2 DKO) mice. *P < 0.05, n = 7 mice. (C) rCASP6 (i.t., 5 U, 3 hours) increases TNF-α levels in spinal cord but not DRG tissues. *P < 0.05, n = 4 mice. (D) rCASP6-induced (i.t., 5 U) mechanical allodynia is reduced by minocycline pretreatment (i.t., 50 μg). *P < 0.05, n = 5 mice. (E) Spinal (i.t.) injection of rCASP6-stimulated microglia, but not control microglia, induces mechanical allodynia. *P < 0.05, n = 5–7 mice. (F) Transient reversal of mechanical allodynia following injection of rCASP6-stimulated microglia by i.t. TNF-α–neutralizing antibody (5 μg). *P < 0.05, n = 5–7 mice.
Figure 8
Figure 8. rCASP6 increases EPSCs in lamina IIo neurons of spinal cord slices via TNF-α signaling.
(A) Traces of sEPSCs in lamina II neurons of spinal cord slices with and without rCASP6 (5 U/ml) and TNF-α (10 ng/ml) incubation. Bottom panels: Enlargement of traces 1–4. Note the same neuron responds to both rCASP6 and TNF-α. (B) Frequency and amplitude of sEPSCs as shown in A. Note that rCASP6 and TNF-α only increase the sEPSC frequency. *P < 0.05, n = 6–8 neurons. (C) Traces of sEPSCs before and after rCASP3 (5 U/ml) and TNF-α (10 ng/ml) incubation. Note that rCASP3 does not change sEPSCs. Bottom panels: Frequency and amplitude of sEPSCs. n = 5 neurons. (D) Traces of sEPSCs in spinal cord slices of Tnfr1/2 DKO mice before and after rCASP6 (5 U/ml) incubation. (E) Frequency and amplitude of sEPSCs in Tnfr1/2 DKO mice before and after rCASP6 treatment. Note that rCASP6 does not alter sEPSCs in the DKO mice. n = 6 neurons. (F) Traces of eEPSCs in lamina IIo neurons of spinal cord slices following dorsal root stimulation before and after TNF-α (10 ng/ml) and rCASP6 (5 U/ml). Amplitude of eEPSCs as fold difference relative to control. *P < 0.05, n = 7–15 neurons.
Figure 9
Figure 9. Endogenous CASP6 is essential for inducing spinal cord synaptic plasticity in spinal cord slices and LTP in spinal cord of anesthetized mice.
(A) Traces of sEPSCs in lamina IIo neurons of spinal cord slices of WT and Casp6–/– mice before and after CFA inflammation (1 day). (B) Frequency of sEPSCs in WT and Casp6–/– mice before and after CFA inflammation and the effects of the CASP6 inhibitor ZVEID. Note the impairment of CFA-induced sEPSC but not the basal sEPSC increases in Casp6–/– mice. Also note the inhibition of sEPSCs after CFA inflammation by ZVEID in WT but not Casp6–/– mice. *P < 0.05, n = 5–6 neurons. (C) Tetanic stimulation (100 Hz, 1 second, 4 trains, 10 second interval) induces LTP of C-fiber–evoked field potentials in the dorsal horn of anesthetized WT mice but not in Casp6–/– mice. *P < 0.05 (2-way ANOVA, n = 5 mice). (D) Reversal of LTP of C-fiber–evoked field potentials in the dorsal horn of anesthetized mice by the CASP6 inhibitor (10 μg, i.t.), administered 2 hours after LTP induction. *P < 0.05 (2-way ANOVA, n = 5 mice). (E) Traces of sEPSCs before and after capsaicin (CAP) treatment (0.5 μM) and the effects of ZVEID (10 μg/ml). (F) Frequency and amplitude of sEPSCs recorded in E. *P < 0.05, n = 5–6 neurons. (G) Traces of eEPSCs following dorsal root stimulation and the effects of the CASP6 inhibitor in WT and Casp6–/– mice. (H) Amplitude of eEPSCs. Note that the CASP6 inhibitor loses its effects in Casp6–/– mice. *P < 0.05, n = 5–15 neurons.
Figure 10
Figure 10. rCASP6 and rCASP6-activated microglia enhance EPSCs in lamina IIo neurons of spinal cord slices via microglial and TNF-α signaling.
(A) Traces of sEPSCs in lamina IIo neurons of spinal cord slices before and after treatment with rCASP6 (5 U/ml), TNF-α (10 ng/ml), and minocycline (50 nM). (B) Frequency of sEPSCs and the effects of rCASP6, TNF-α, capsaicin (0.5 μM), and minocycline. Note that minocycline suppresses the sEPSC increase induced by rCASP6 and capsaicin, but not TNF-α. *P < 0.05, n = 6–8 neurons. (C) Traces of eEPSCs following dorsal root stimulation in the presence of minocycline (50 nM) and minocycline plus rCASP6 (5 U/ml). Right panel: Amplitude of eEPSCs. Note that rCASP6 fails to increase eEPSCs after minocycline treatment. n = 5 neurons. (D) Traces of sEPSCs following incubation of slices with AMM. The microglial cultures were preactivated by rCASP6 (5 U/ml) for 3 hours and washed with PBS, and the culture medium was collected 3 hours later. Note that the sEPSC frequency increase by AMM is reversed by the TNF-α–neutralizing antibody (1 μg/ml). (E) Frequency and amplitude of sEPSC as shown in E. *P < 0.05, n = 5 neurons.

Similar articles

Cited by

References

    1. Basbaum AI, Bautista DM, Scherrer G, Julius D. Cellular and molecular mechanisms of pain. Cell. 2009;139(2):267–284. doi: 10.1016/j.cell.2009.09.028. - DOI - PMC - PubMed
    1. Hucho T, Levine JD. Signaling pathways in sensitization: toward a nociceptor cell biology. Neuron. 2007;55(3):365–376. doi: 10.1016/j.neuron.2007.07.008. - DOI - PubMed
    1. Ji RR, Kohno T, Moore KA, Woolf CJ. Central sensitization and LTP: do pain and memory share similar mechanisms? Trends Neurosci. 2003;26(12):696–705. doi: 10.1016/j.tins.2003.09.017. - DOI - PubMed
    1. Woolf CJ, Salter MW. Neuronal plasticity: increasing the gain in pain. Science. 2000;288(5472):1765–1769. doi: 10.1126/science.288.5472.1765. - DOI - PubMed
    1. Kuner R. Central mechanisms of pathological pain. Nat Med. 2010;16(11):1258–1266. doi: 10.1038/nm.2231. - DOI - PubMed

Publication types

MeSH terms