

Biochemical phenotype of a common disease-causing mutation and a possible therapeutic approach for the phosphomannomutase 2-associated disorder of glycosylation
- PMID: 24498599
- PMCID: PMC3893156
- DOI: 10.1002/mgg3.3
Biochemical phenotype of a common disease-causing mutation and a possible therapeutic approach for the phosphomannomutase 2-associated disorder of glycosylation
Abstract
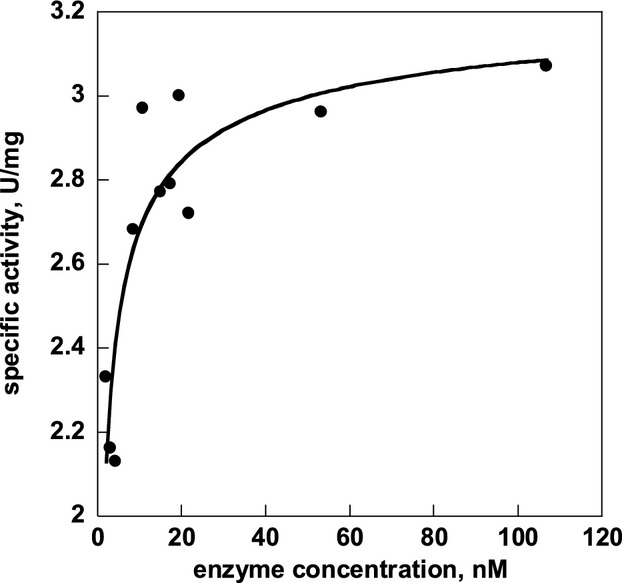
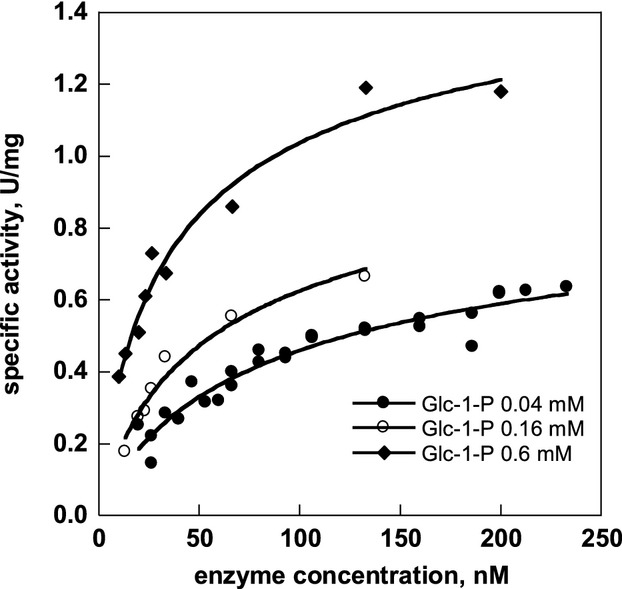
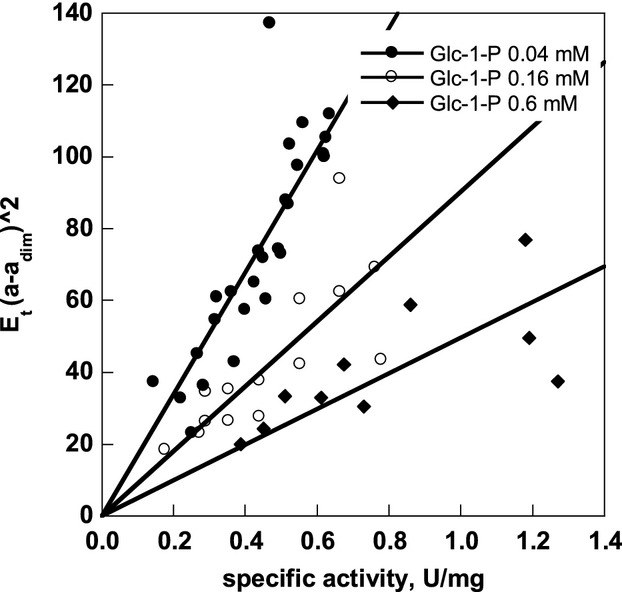
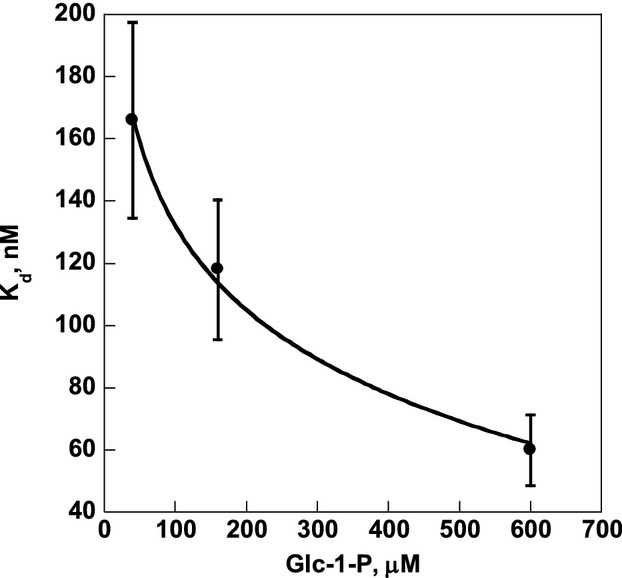
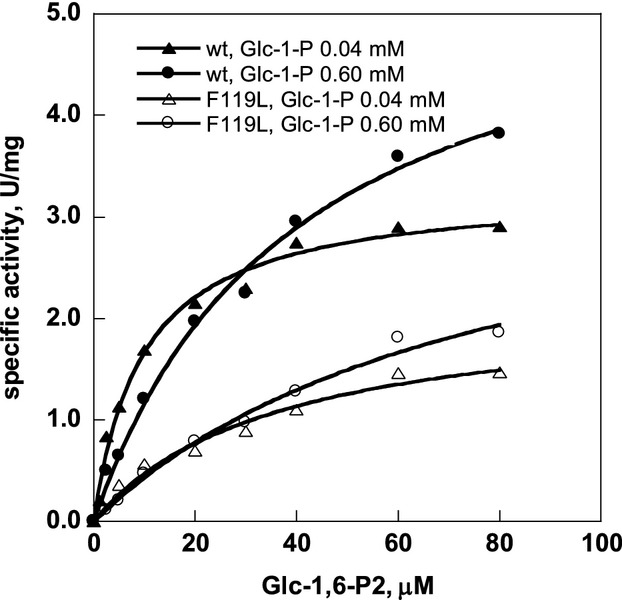
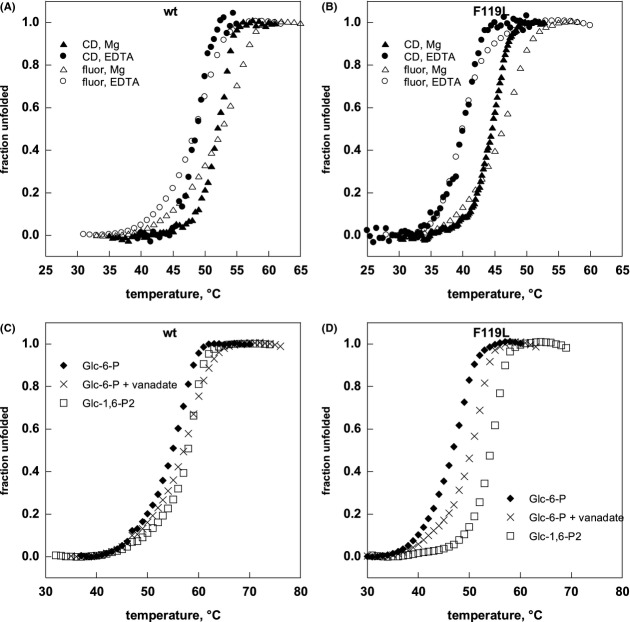
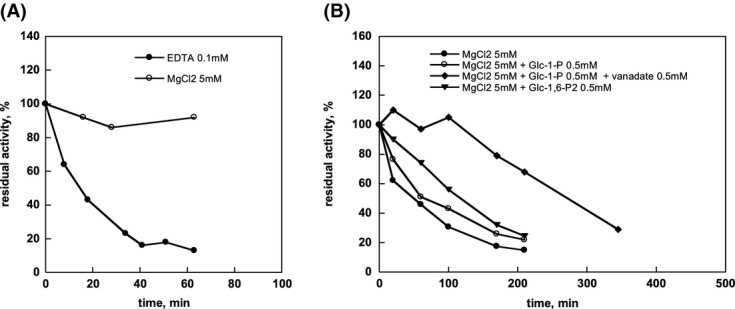
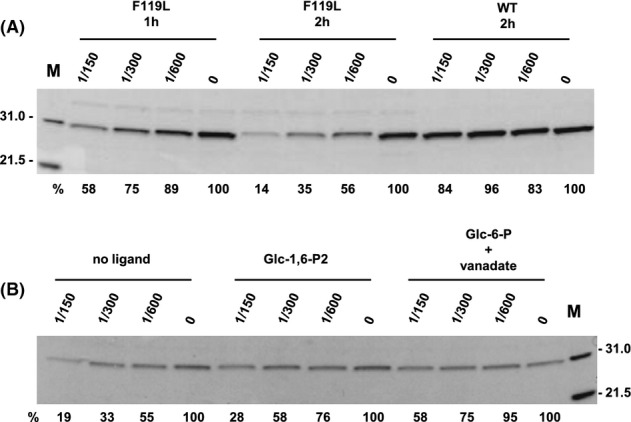
Phosphomannomutase 2 (PMM2) deficiency represents the most frequent type of congenital disorders of glycosylation. For this disease there is no cure at present. The complete loss of phosphomannomutase activity is probably not compatible with life and people affected carry at least one allele with residual activity. We characterized wild-type PMM2 and its most common hypomorphic mutant, p.F119L, which is associated with a severe phenotype of the disease. We demonstrated that active species is the dimeric enzyme and that the mutation weakens the quaternary structure and, at the same time, affects the activity and the stability of the enzyme. We demonstrated that ligand binding stabilizes both proteins, wild-type and F119L-PMM2, and promotes subunit association in vitro. The strongest effects are observed with glucose-1,6-bisphosphate (Glc-1,6-P2) or with monophosphate glucose in the presence of vanadate. This finding offers a new approach for the treatment of PMM2 deficiency. We propose to enhance Glc-1,6-P2 concentration either acting on the metabolic pathways that control its synthesis and degradation or exploiting prodrugs that are able to cross membranes.
Keywords: Congenital disorders of glycosylation; N-glycosylation; glucose 1,6-bisphosphate; phosphomannomutase.
Figures

Similar articles
-
Insight on molecular pathogenesis and pharmacochaperoning potential in phosphomannomutase 2 deficiency, provided by novel human phosphomannomutase 2 structures.J Inherit Metab Dis. 2022 Mar;45(2):318-333. doi: 10.1002/jimd.12461. Epub 2021 Dec 13. J Inherit Metab Dis. 2022. PMID: 34859900
-
Yeast Models of Phosphomannomutase 2 Deficiency, a Congenital Disorder of Glycosylation.G3 (Bethesda). 2019 Feb 7;9(2):413-423. doi: 10.1534/g3.118.200934. G3 (Bethesda). 2019. PMID: 30530630 Free PMC article.
-
Heterodimerization of Two Pathological Mutants Enhances the Activity of Human Phosphomannomutase2.PLoS One. 2015 Oct 21;10(10):e0139882. doi: 10.1371/journal.pone.0139882. eCollection 2015. PLoS One. 2015. PMID: 26488408 Free PMC article.
-
Clinical, laboratory and molecular findings and long-term follow-up data in 96 French patients with PMM2-CDG (phosphomannomutase 2-congenital disorder of glycosylation) and review of the literature.J Med Genet. 2017 Dec;54(12):843-851. doi: 10.1136/jmedgenet-2017-104903. Epub 2017 Sep 27. J Med Genet. 2017. PMID: 28954837 Review.
-
New and potential strategies for the treatment of PMM2-CDG.Biochim Biophys Acta Gen Subj. 2020 Nov;1864(11):129686. doi: 10.1016/j.bbagen.2020.129686. Epub 2020 Jul 23. Biochim Biophys Acta Gen Subj. 2020. PMID: 32712172 Review.
Cited by
-
Second-Generation Pharmacological Chaperones: Beyond Inhibitors.Molecules. 2020 Jul 9;25(14):3145. doi: 10.3390/molecules25143145. Molecules. 2020. PMID: 32660097 Free PMC article. Review.
-
The Analysis of Variants in the General Population Reveals That PMM2 Is Extremely Tolerant to Missense Mutations and That Diagnosis of PMM2-CDG Can Benefit from the Identification of Modifiers.Int J Mol Sci. 2018 Jul 30;19(8):2218. doi: 10.3390/ijms19082218. Int J Mol Sci. 2018. PMID: 30061496 Free PMC article.
-
Pharmacological Chaperones: A Therapeutic Approach for Diseases Caused by Destabilizing Missense Mutations.Int J Mol Sci. 2020 Jan 13;21(2):489. doi: 10.3390/ijms21020489. Int J Mol Sci. 2020. PMID: 31940970 Free PMC article. Review.
-
A mouse model of a human congenital disorder of glycosylation caused by loss of PMM2.Hum Mol Genet. 2016 Jun 1;25(11):2182-2193. doi: 10.1093/hmg/ddw085. Epub 2016 Apr 5. Hum Mol Genet. 2016. PMID: 27053713 Free PMC article.
-
Congenital disorders of glycosylation: narration of a story through its patents.Orphanet J Rare Dis. 2023 Aug 29;18(1):247. doi: 10.1186/s13023-023-02852-w. Orphanet J Rare Dis. 2023. PMID: 37644541 Free PMC article. Review.
References
-
- Benito JM, Garcia Fernandez JM, Ortiz Mellet C. Pharmacological chaperone therapy for Gaucher disease: a patent review. Exp. Opin. Ther. Pat. 2011;21:885–903. - PubMed
-
- Borkowski T, Orlewska C, Slominska EM, Yuen A, Lipinski M, Rybakowska I, et al. Pharmacological inhibition of AMP-deaminase in rat cardiac myocytes. Nucleosides Nucleotides Nucleic Acids. 2008;27:867–871. - PubMed
Grants and funding
LinkOut - more resources
Full Text Sources
Other Literature Sources
