. 2014:5:3214.
doi: 10.1038/ncomms4214.

USP11 regulates PML stability to control Notch-induced malignancy in brain tumours

Affiliations

USP11 regulates PML stability to control Notch-induced malignancy in brain tumours

Hsin-Chieh Wu et al. Nat Commun. 2014.

Erratum in

Abstract

The promyelocytic leukaemia (PML) protein controls multiple tumour suppressive functions and is downregulated in diverse types of human cancers through incompletely characterized post-translational mechanisms. Here we identify USP11 as a PML regulator by RNAi screening. USP11 deubiquitinates and stabilizes PML, thereby counteracting the functions of PML ubiquitin ligases RNF4 and the KLHL20-Cul3 (Cullin 3)-Roc1 complex. We find that USP11 is transcriptionally repressed through a Notch/Hey1-dependent mechanism, leading to PML destabilization. In human glioma, Hey1 upregulation correlates with USP11 and PML downregulation and with high-grade malignancy. The Notch/Hey1-induced downregulation of USP11 and PML not only confers multiple malignant characteristics of aggressive glioma, including proliferation, invasiveness and tumour growth in an orthotopic mouse model, but also potentiates self-renewal, tumour-forming capacity and therapeutic resistance of patient-derived glioma-initiating cells. Our study uncovers a PML degradation mechanism through Notch/Hey1-induced repression of the PML deubiquitinase USP11 and suggests an important role for this pathway in brain tumour pathogenesis.


Conflict of interest statement

The authors declare no competing financial interests.

Figures

Figure 1
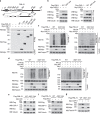
Figure 1. USP11 interacts with and stabilizes PML.
(a) Schematic presentation of the screening procedure to identify DUBs that regulate PML. Representative images of cells transduced with lentivirus containing control or USP11 shRNA are shown on the bottom. Scale bar, 20 μm. (b) USP11 shRNAs reduce PML protein but not mRNA. HeLa cells transduced with lentivirus carrying USP11 shRNA or control shRNA were analysed by western blot with indicated antibodies (top) or by reverse transcriptase–quantitative PCR (bottom). Data shown are mean±s.d. of three independent experiments. (c) HeLa cells transduced with indicated lentiviruses were treated with 1 μM MG132 for 18 h and analysed by western blot. (d,f) The effects of USP11 knockdown (d) or overexpression (f) on PML half-life. HeLa cells stably expressing indicated shRNAs (d), or U87 cells transfected with indicated constructs (f) were treated with 100 μg ml−1 cycloheximide for indicated time periods and were analysed by western blot. The levels of PML relative to that seen at 0 h were quantified and plotted on the left panels and the PML half-life in each cell is indicated on the bottom. (e) Western blot analysis of PML level in HeLa cells transfected with indicated constructs. (g) USP11 interacts with PML-I and PML-IV. Coimmunoprecipitation analysis of 293T cells transfected with indicated constructs. (h) Interaction of endogenous PML with endogenous USP11 in T98G GBM cells and H4 glioma cells was analysed by coimmunoprecipitation. Lysate of PML-null MEFs was used as a control. (i) USP11 and PML interact in vitro. Baculovirally purified USP11 bound on Myc-agarose beads was used to pull down baculovirally purified PML-I. Bound proteins were analysed by western blot with indicated antibodies. (j) Mapping of the USP11 domain involved in PML interaction. The domain organization of USP11 is shown on the top panel. Interaction of PML-I with indicated USP11 mutants in transfected 293T cells was analysed by coimmunoprecipitation (bottom panels).
Figure 2
Figure 2. USP11 deubiquitinates PML and antagonizes the function of PML ubiquitin ligases.
(a,b) USP11 shRNAs increase the ubiquitination levels of PML-I (a) and PML-IV (b). Immunoprecipitation and/or western blot analysis of 293T cells transduced with lentivirus expressing control or USP11 shRNAs and transfected with indicated constructs. (c) Tandem affinity purification of ubiquitinated endogenous PML under denaturing conditions form U87 cells transduced with lentivirus expressing control or USP11 shRNAs and transfected with His-ubiquitin. (d) USP11 decreases PML-I ubiquitination in vivo. PML-I ubiquitination in 293T cells transfected with indicated constructs was analysed as in a. (e) In vitro deubiquitination of PML by USP11. Purified PML-I was subjected to in vitro ubiquitination reaction in the presence of E1, E2 and Roc1–Cul3–KLHL20 complex and the resulting products were incubated with baculovirally purified USP11 or its mutant for deubiquitination (Methods). The reaction products were examined by western blot with indicated antibodies.
Figure 3
Figure 3. USP11-mediated PML stabilization inhibits glioma cell migration and invasion.
(a) Western blot analysis of USP11 and PML expression in U251 cells transduced with lentivirus carrying control (−) or PML shRNA and/or USP11 expression construct. (b) Proliferation, migration and invasion capabilities of U251 cells as in a. (c) Western blot analysis of USP11 and PML expression in H4 cells transduced with lentivirus carrying control (−) or indicated shRNAs and/or resistant USP11 (USP11r) construct. (d) H4 cells as in c were transduced with or without lentivirus carrying PML-IV and assayed for proliferation, migration and invasion. Data in panels b and d are mean±s.d. (***P<0.001 by t-test) of three independent experiments.
Figure 4
Figure 4. Hey1 downregulates USP11 and PML in GBM.
(a) Representative IHC staining for Hey1, USP11 and PML in consecutive slides derived from a grade II astrocytoma specimen and a grade IV GBM specimen. Scale bar, 50 μm. The boxed area is enlarged to show in the inset for visualizing PML-NBs. (b) Summary of the Hey1, USP11 and PML expression profiles in 95 grade II/III and 80 grade IV glioma patients. (c) Correlations among the Hey1, USP11 and PML expression levels in the cohort of 175 glioma patients. The P values in panels b and c were calculated by Fisher’s exact test. (d) Western blot (left panels) and reverse transcriptase (RT)–quantitative PCR (qPCR; right panels) analysis of USP11 and PML expression in U87 cells transfected with Hey1. (e) Western blot and RT–qPCR analysis of USP11 and PML expression in U251 cells transfected with Hey1. (f) Western blot and RT–qPCR analysis in U87 cells transfected with Hey1 siRNAs. (g) Western blot and RT–qPCR analysis in U251 cells transfected with Hey1 siRNAs. Data in panels dg are mean±s.d. (**P<0.01 and ***P<0.001 by t-test) of three independent experiments.
Figure 5
Figure 5. Sp1 recruits Hey1 to the USP11 promoter to induce transcriptional repression.
(a) Schematic representation of the 5′-regulatory region of USP11 gene, the luciferase reporter and the ChIP primers used in this study. The positions of two E boxes and four Sp1-binding regions are indicated. (b) qChIP assay in U87 cells transfected with control vector or Flag-Hey1 using control IgG or anti-Flag antibody for immunoprecipitation and indicated primer set for quantitative PCR. (c) qChIP analysis in U87 cells stably expressing indicated shRNAs using control IgG or Hey1 antibody for immunoprecipitation. Primer set IV was used for qChIP assays thereafter. (d) Reporter activity assay of U87 cells transfected with control vector or Flag-Hey1 together with indicated reporter constructs. The luciferase activities in the Flag-Hey1-expressing cells were normalized with those in the control cells. (e) qChIP analysis in U87 cells with control or Sp1 antibody. (f) qChIP analysis in U87 cells expressing control or Sp1 shRNAs with indicated antibodies. The expression levels of Sp1 protein are shown on the top. (g) Re-ChIP analysis in U87 cells with indicated antibodies. (h) Promoter activity assay of U87 cells transfected with the wild-type luciferease reporter construct shown in a together with indicated siRNAs. The relative Hey1 and Sp1 mRNA levels in each group are shown on the right. (i) A model for the mechanism by which Hey1 represses USP11 transcription (see text). (j) qChIP analysis in U87 cells transfected with Hey1 shRNAs with indicated antibodies. Data in all panels are mean±s.d. (**P<0.01 and ***P<0.001 by t-test) of three independent experiments.
Figure 6
Figure 6. Notch acts upstream of Hey1 to induce USP11 and PML downregulation.
(a) Western blot analysis of USP11 and PML expression in U87 cells transfected with NIC (left) or treated with 10 μM DAPT for 36 h (right). (b) Western blot analysis of USP11 and PML expression in U251 cells transfected with NIC (left) or treated with 10 μM DAPT for 36 h (right). (c) Western blot analysis of USP11, PML and Notch1 expression in U87 cells transfected with indicated siRNAs. (d) Immunoprecipitation and western blot analysis of PML-I ubiquitination in U87 and U251 cells transfected with indicated constructs. (e) Immunoprecipitation and western blot analysis of PML-I ubiquitination in U87 and U251 cells transfected with indicated constructs and treated with or without DAPT. (f) Immunoprecipitation and western blot analysis of PML-I ubiquitination in U87 and U251 cells transfected with indicated constructs and siRNA. (g) Western blot analysis of USP11 and PML expression in U87 or U251 cells transfected with NIC and treated with 1 μM MG132 for 18 h. (h) Western blot analysis of USP11 and PML expression in indicated GICs transfected with NIC. (i) Western blot analysis of USP11 and PML expression in indicated GICs treated with DAPT. (j) Western blot analysis of USP11, PML and Notch1 expression in indicated GICs transfected with Notch1 siRNAs.
Figure 7
Figure 7. Notch/Hey1-induced PML degradation pathway promotes GBM malignant phenotypes.
(a) Western blot analysis of PML and USP11 expression levels in U251 derivatives. These stable lines were used in experiments shown in panels bd. (b) Proliferation assay of U251 derivatives treated with or without 10 μM DAPT. (c) Proliferation assay of U251 derivatives as indicated. (d) Soft agar colony formation assay of U251 derivatives. Representative images are shown on the left and quantitative data are on the right. Data in panels bd are mean±s.d. (***P<0.001 by t-test of three independent experiments). (eg) Kaplan–Meier survival curves of mice implanted with U87 cells stably expressing indicated constructs (upper panels), n=6 mice for each indicated cell line. The P values were determined by log-rank test. Representative light micrographs of brain tumours formed at indicated days after implantation are shown on the bottom panels. Brain tumours are marked by arrows. Scale bars, 2 mm. The expression levels of USP11 and PML in the U87 derivatives are shown in Supplementary Fig. 5a.
Figure 8
Figure 8. Notch/Heyl-induced PML degradation pathway promotes GIC characteristic.
(a) Neurosphere-forming abilities of GBM9 cells stably expressing indicated constructs. (b) Neurosphere-forming abilities of GBM9 cells stably expressing indicated constructs. (c) Neurosphere-forming abilities of GBM9 cells stably expressing indicated constructs. For panels (ac), representative images of GIC neurospheres and their diameters (represented as mean±s.d. of three independent experiments, 30 neurospheres per group per experiment) are indicated on the bottom. Scale bars, 100 μm. (d) Effect of Notch-induced PML degradation pathway on the chemoresistant character of GICs. Apoptosis assay of GBM9 cells stably expressing indicated constructs and treated with TMZ and/or DAPT as described in Methods. (f) Apoptosis assay of GBM9 cells stably expressing indicated constructs and treated with TMZ. (f,g) Kaplan–Meier survival curves (upper panels) of mice implanted with 1 × 10³ GBM9 cells stably expressing indicated constructs, n=5 mice (f) and n=6 mice (g) for each indicated cell line (upper panels). The P values were determined by log-rank test. Representative light micrograph of brain tumours formed at indicated days after implantation are shown on the bottom panels. Brain tumours are marked by arrows. Scale bars, 2 mm. Data in panels ae are mean±s.d. (**P<0.01 by t-test,***P<0.001) of three independent experiments.
Figure 9
Figure 9. Generation of a USP11-resistant mutant of PML.
(a) Mapping of the USP11-interacting region on PML. The domain organization of PML is shown on the top. Interaction of USP11 with indicated PML deletion mutants in transfected 293T cells was analysed by coimmunoprecipitation assay. (b) PML 327–344 is required for interaction with USP11. 293T cells transfected with indicated constructs were analysed by coimmunoprecipitation. Of note, the amounts of PML deletion mutants used in transfection were adjusted to achieve similar expression levels of various PML proteins. (c,d) USP11, NIC and Hey1 cannot regulate the ubiquitination of PML d327-344 mutant. Immunoprecipitation and/or western blot analysis of PML-I or PML-IV ubiquitination in U87 cells transfected with indicated constructs. (eg) Western blot analysis of PML expression levels in U87 cells transfected with indicated constructs.
Figure 10
Figure 10. The effects of Notch/Hey1 and USP11 on GBM and GIC are dependent on PML.
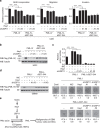
(a) Proliferation, migration and invasion assays of U251 cells stably expressing indicated constructs. (b,d) Western blot analysis of PML expression in U251 and GBM9 cells stably expressing indicated constructs. These stable lines were used for experiments shown in a and c. Of note, to generate stable lines expressing comparable levels of wild type and mutant PML proteins, a higher titre of PML-IV-d327-344-expressing lentivirus was used for infection. (c) Sphere-forming assay of GBM9 cells stably expressing indicated constructs. Representative images of GIC neurospheres and their diameters (represented as mean±s.d. of 3 independent experiments, 30 neurospheres per group per experiment) are indicated on the bottom. Scale bars, 100 μm. Data in panels a and c are mean±s.d. (***P<0.001 by t-test) of three independent experiments. (e) Schematic presentation of the Notch-induced PML degradation pathway and its functions in GBM.

Similar articles

Cited by

References

    1. de The H., Chomienne C., Lanotte M., Degos L. & Dejean A. The t(15;17) translocation of acute promyelocytic leukaemia fuses the retinoic acid receptor alpha gene to a novel transcribed locus. Nature 347, 558–561 (1990). - PubMed
    1. de The H. et al. The PML-RAR alpha fusion mRNA generated by the t(15;17) translocation in acute promyelocytic leukemia encodes a functionally altered RAR. Cell 66, 675–684 (1991). - PubMed
    1. Ishov A. M. et al. PML is critical for ND10 formation and recruits the PML-interacting protein daxx to this nuclear structure when modified by SUMO-1. J. Cell Biol. 147, 221–234 (1999). - PMC - PubMed
    1. Bernardi R. & Pandolfi P. P. Structure, dynamics and functions of promyelocytic leukaemia nuclear bodies. Nat. Rev. Mol. Cell. Biol. 8, 1006–1016 (2007). - PubMed
    1. Reineke E. L., Liu Y. & Kao H. Y. Promyelocytic leukemia protein controls cell migration in response to hydrogen peroxide and insulin-like growth factor-1. J. Biol. Chem. 285, 9485–9492 (2010). - PMC - PubMed

Publication types

MeSH terms