

Large-scale mitochondrial DNA analysis in Southeast Asia reveals evolutionary effects of cultural isolation in the multi-ethnic population of Myanmar
- PMID: 24467713
- PMCID: PMC3913319
- DOI: 10.1186/1471-2148-14-17
Large-scale mitochondrial DNA analysis in Southeast Asia reveals evolutionary effects of cultural isolation in the multi-ethnic population of Myanmar
Abstract
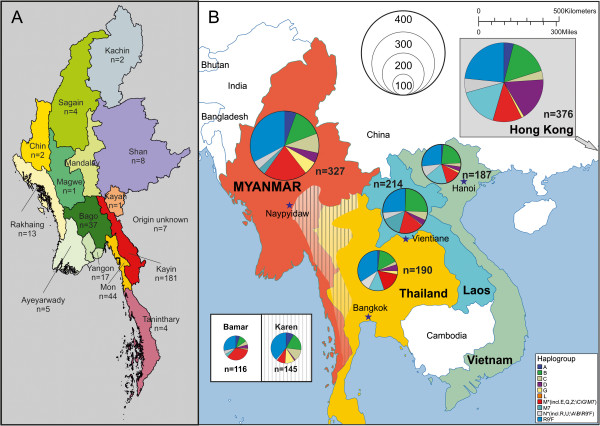
Background: Myanmar is the largest country in mainland Southeast Asia with a population of 55 million people subdivided into more than 100 ethnic groups. Ruled by changing kingdoms and dynasties and lying on the trade route between India and China, Myanmar was influenced by numerous cultures. Since its independence from British occupation, tensions between the ruling Bamar and ethnic minorities increased.
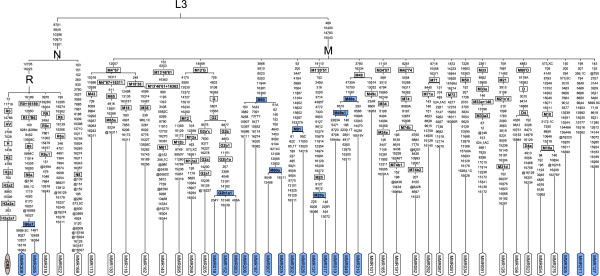
Results: Our aim was to search for genetic footprints of Myanmar's geographic, historic and sociocultural characteristics and to contribute to the picture of human colonization by describing and dating of new mitochondrial DNA (mtDNA) haplogroups. Therefore, we sequenced the mtDNA control region of 327 unrelated donors and the complete mitochondrial genome of 44 selected individuals according to highest quality standards.
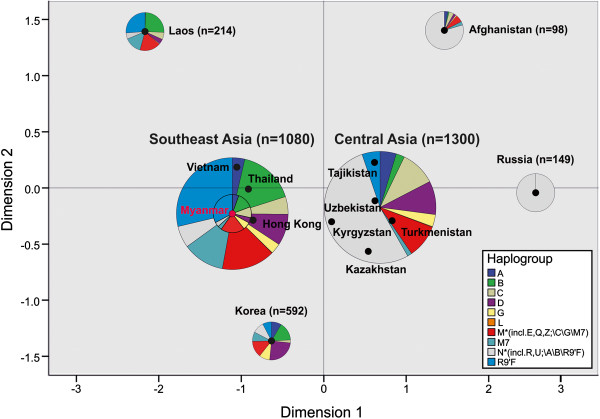
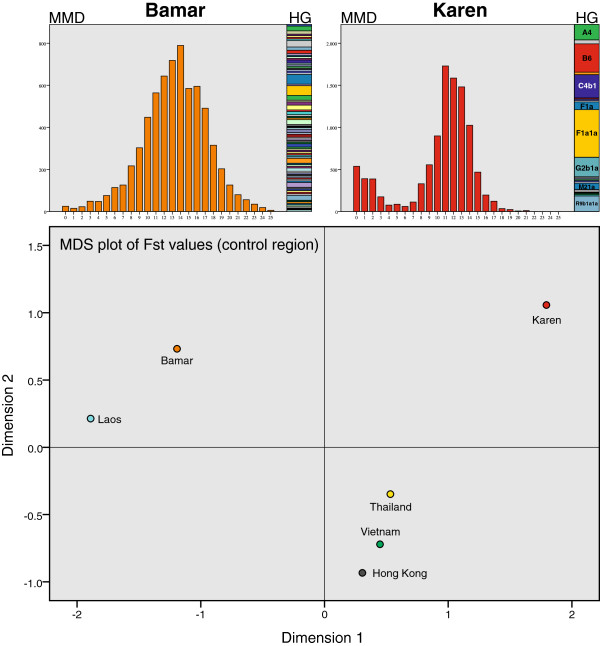
Conclusion: Phylogenetic analyses of the entire mtDNA genomes uncovered eight new haplogroups and three unclassified basal M-lineages. The multi-ethnic population and the complex history of Myanmar were reflected in its mtDNA heterogeneity. Population genetic analyses of Burmese control region sequences combined with population data from neighboring countries revealed that the Myanmar haplogroup distribution showed a typical Southeast Asian pattern, but also Northeast Asian and Indian influences. The population structure of the extraordinarily diverse Bamar differed from that of the Karen people who displayed signs of genetic isolation. Migration analyses indicated a considerable genetic exchange with an overall positive migration balance from Myanmar to neighboring countries. Age estimates of the newly described haplogroups point to the existence of evolutionary windows where climatic and cultural changes gave rise to mitochondrial haplogroup diversification in Asia.
Figures
Similar articles
-
Ancient inland human dispersals from Myanmar into interior East Asia since the Late Pleistocene.Sci Rep. 2015 Mar 26;5:9473. doi: 10.1038/srep09473. Sci Rep. 2015. PMID: 25826227 Free PMC article.
-
Tracing the Austronesian footprint in Mainland Southeast Asia: a perspective from mitochondrial DNA.Mol Biol Evol. 2010 Oct;27(10):2417-30. doi: 10.1093/molbev/msq131. Epub 2010 May 31. Mol Biol Evol. 2010. PMID: 20513740
-
mtDNA structure: the women who formed the Brazilian Northeast.BMC Evol Biol. 2017 Aug 9;17(1):185. doi: 10.1186/s12862-017-1027-7. BMC Evol Biol. 2017. PMID: 28793858 Free PMC article.
-
Ancient migration routes of Austronesian-speaking populations in oceanic Southeast Asia and Melanesia might mimic the spread of nasopharyngeal carcinoma.Chin J Cancer. 2011 Feb;30(2):96-105. doi: 10.5732/cjc.010.10589. Chin J Cancer. 2011. PMID: 21272441 Free PMC article. Review.
-
Recent progress in mitochondrial DNA analysis.Leg Med (Tokyo). 2005 Jul;7(4):259-62. doi: 10.1016/j.legalmed.2005.01.005. Leg Med (Tokyo). 2005. PMID: 15939655 Review.
Cited by
-
Ancient inland human dispersals from Myanmar into interior East Asia since the Late Pleistocene.Sci Rep. 2015 Mar 26;5:9473. doi: 10.1038/srep09473. Sci Rep. 2015. PMID: 25826227 Free PMC article.
-
Carriers of human mitochondrial DNA macrohaplogroup M colonized India from southeastern Asia.BMC Evol Biol. 2016 Nov 10;16(1):246. doi: 10.1186/s12862-016-0816-8. BMC Evol Biol. 2016. PMID: 27832758 Free PMC article.
-
Haplotype diversity in mitochondrial genome in a Chinese Han population.J Hum Genet. 2016 Oct;61(10):903-906. doi: 10.1038/jhg.2016.74. Epub 2016 Jun 16. J Hum Genet. 2016. PMID: 27305984
-
New insights from Thailand into the maternal genetic history of Mainland Southeast Asia.Eur J Hum Genet. 2018 Jun;26(6):898-911. doi: 10.1038/s41431-018-0113-7. Epub 2018 Feb 26. Eur J Hum Genet. 2018. PMID: 29483671 Free PMC article.
-
Contrasting maternal and paternal genetic variation of hunter-gatherer groups in Thailand.Sci Rep. 2018 Jan 24;8(1):1536. doi: 10.1038/s41598-018-20020-0. Sci Rep. 2018. PMID: 29367746 Free PMC article.
References
-
- Avise JC, Arnold J, Ball RM, Bermingham E, Lamb T, Neigel JE. et al.Intraspecific phylogeography: the mitochondrial DNA bridge between population genetics and systematics. Annu Rev Ecol Syst. 1987;18:489–522.
Publication types
MeSH terms
Substances
LinkOut - more resources
Full Text Sources
Other Literature Sources
