

Organization of the human mitochondrial transcription initiation complex
- PMID: 24413562
- PMCID: PMC3973321
- DOI: 10.1093/nar/gkt1360
Organization of the human mitochondrial transcription initiation complex
Abstract
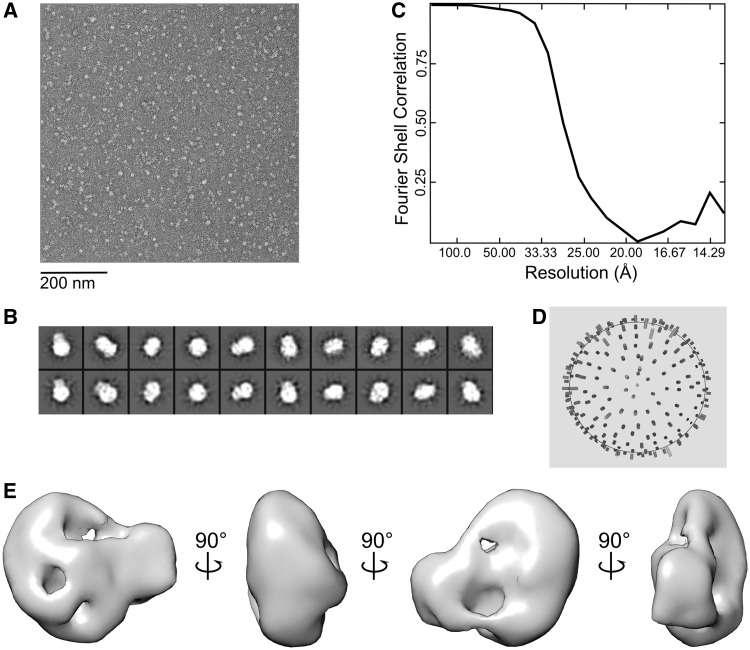
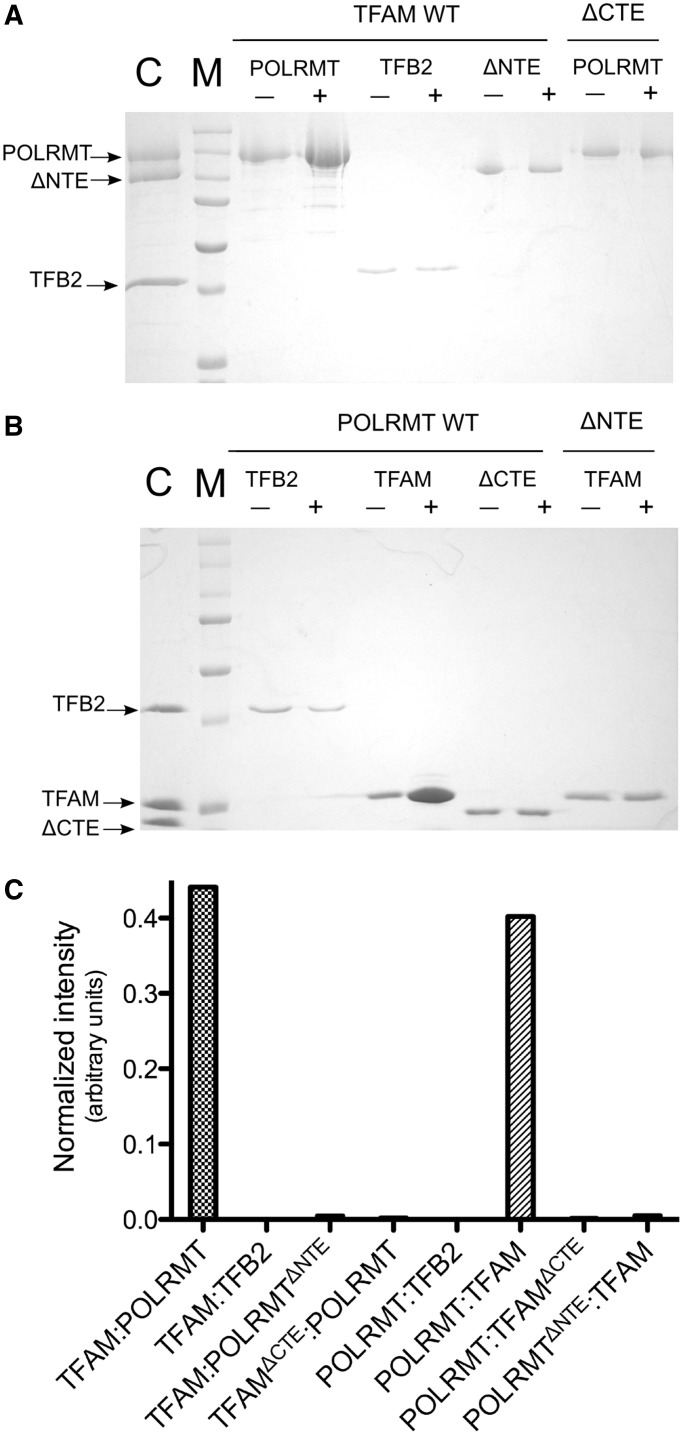
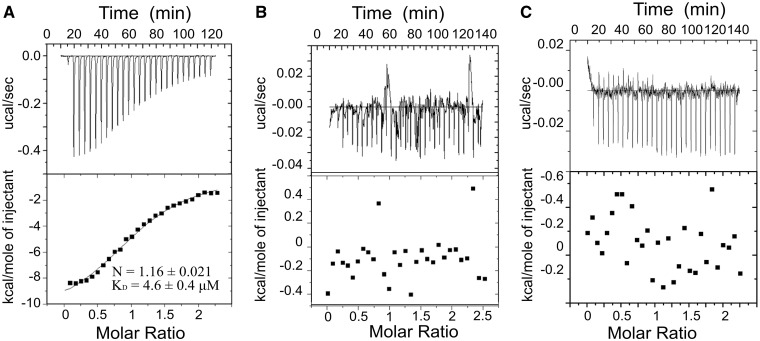
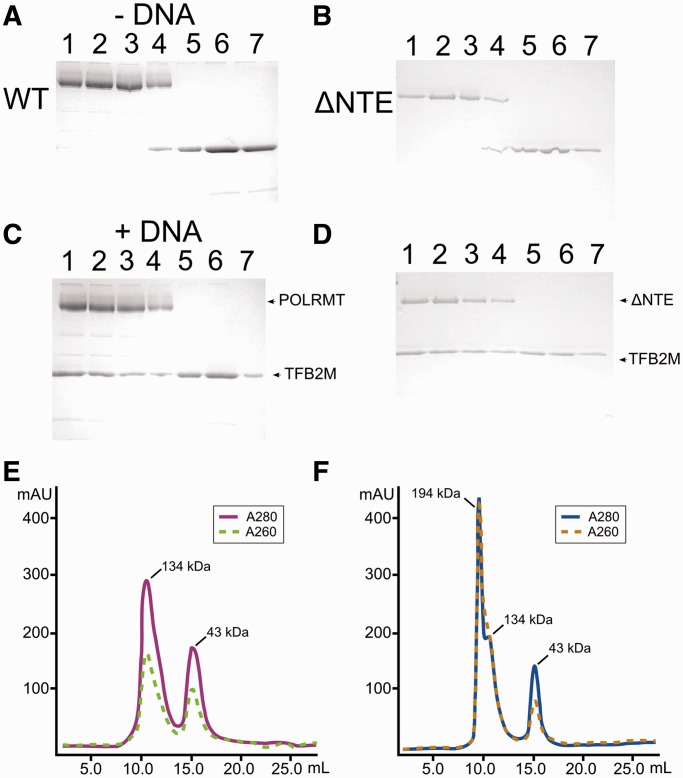
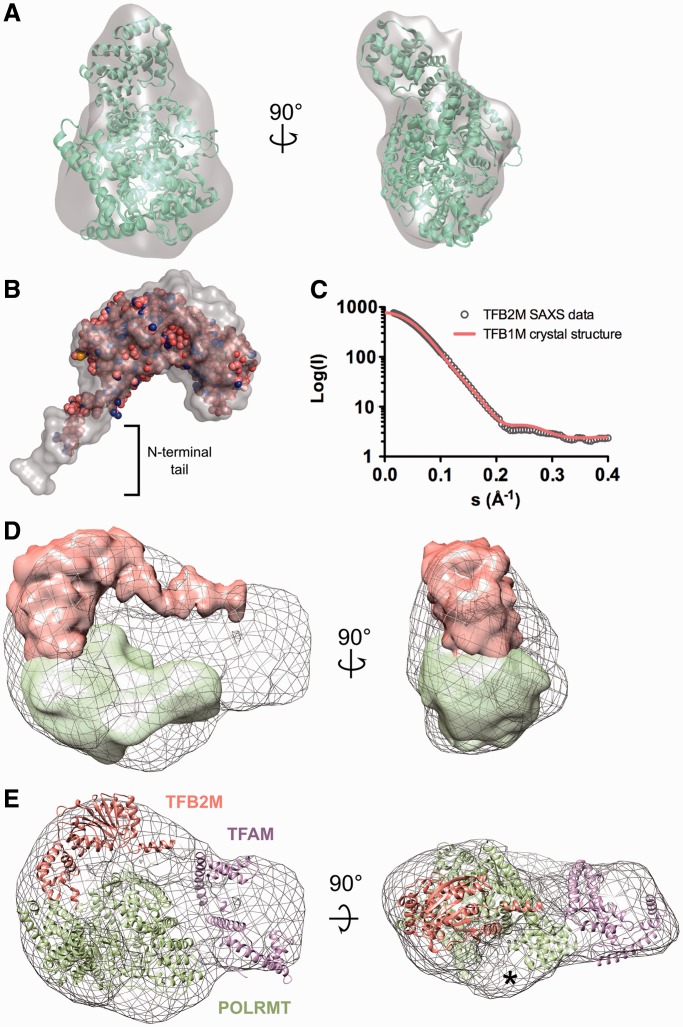
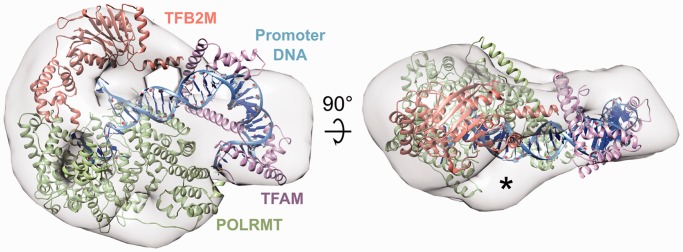
Initiation of transcription in human mitochondria involves two factors, TFAM and TFB2M, in addition to the mitochondrial RNA polymerase, POLRMT. We have investigated the organization of the human mitochondrial transcription initiation complex on the light-strand promoter (LSP) through solution X-ray scattering, electron microscopy (EM) and biochemical studies. Our EM results demonstrate a compact organization of the initiation complex, suggesting that protein-protein interactions might help mediate initiation. We demonstrate that, in the absence of DNA, only POLRMT and TFAM form a stable interaction, albeit one with low affinity. This is consistent with the expected transient nature of the interactions necessary for initiation and implies that the promoter DNA acts as a scaffold that enables formation of the full initiation complex. Docking of known crystal structures into our EM maps results in a model for transcriptional initiation that strongly correlates with new and existing biochemical observations. Our results reveal the organization of TFAM, POLRMT and TFB2M around the LSP and represent the first structural characterization of the entire mitochondrial transcriptional initiation complex.
Figures
Similar articles
-
Structural Basis of Mitochondrial Transcription Initiation.Cell. 2017 Nov 16;171(5):1072-1081.e10. doi: 10.1016/j.cell.2017.10.036. Cell. 2017. PMID: 29149603 Free PMC article.
-
Human mitochondrial transcription factors TFAM and TFB2M work synergistically in promoter melting during transcription initiation.Nucleic Acids Res. 2017 Jan 25;45(2):861-874. doi: 10.1093/nar/gkw1157. Epub 2016 Nov 29. Nucleic Acids Res. 2017. PMID: 27903899 Free PMC article.
-
The amino terminal extension of mammalian mitochondrial RNA polymerase ensures promoter specific transcription initiation.Nucleic Acids Res. 2014 Apr;42(6):3638-47. doi: 10.1093/nar/gkt1397. Epub 2014 Jan 20. Nucleic Acids Res. 2014. PMID: 24445803 Free PMC article.
-
U-turn DNA bending by human mitochondrial transcription factor A.Curr Opin Struct Biol. 2013 Feb;23(1):116-24. doi: 10.1016/j.sbi.2012.12.004. Epub 2013 Jan 16. Curr Opin Struct Biol. 2013. PMID: 23333034 Review.
-
Mitochondrial transcription and its regulation in mammalian cells.Trends Biochem Sci. 2007 Mar;32(3):111-7. doi: 10.1016/j.tibs.2007.01.003. Epub 2007 Feb 8. Trends Biochem Sci. 2007. PMID: 17291767 Review.
Cited by
-
Effect of denervation on the regulation of mitochondrial transcription factor A expression in skeletal muscle.Am J Physiol Cell Physiol. 2015 Aug 15;309(4):C228-38. doi: 10.1152/ajpcell.00266.2014. Epub 2015 Jun 10. Am J Physiol Cell Physiol. 2015. PMID: 26063705 Free PMC article.
-
Yeast mitochondrial RNAP conformational changes are regulated by interactions with the mitochondrial transcription factor.Nucleic Acids Res. 2014;42(17):11246-60. doi: 10.1093/nar/gku795. Epub 2014 Sep 2. Nucleic Acids Res. 2014. PMID: 25183523 Free PMC article.
-
Energizing Genetics and Epi-genetics: Role in the Regulation of Mitochondrial Function.Curr Genomics. 2014 Dec;15(6):436-56. doi: 10.2174/138920291506150106151119. Curr Genomics. 2014. PMID: 25646072 Free PMC article.
-
Mitochondrial genetic variation is enriched in G-quadruplex regions that stall DNA synthesis in vitro.Hum Mol Genet. 2020 May 28;29(8):1292-1309. doi: 10.1093/hmg/ddaa043. Hum Mol Genet. 2020. PMID: 32191790 Free PMC article.
-
Structural basis of mitochondrial transcription.Nat Struct Mol Biol. 2018 Sep;25(9):754-765. doi: 10.1038/s41594-018-0122-9. Epub 2018 Sep 6. Nat Struct Mol Biol. 2018. PMID: 30190598 Free PMC article. Review.
References
-
- Balaban RS, Nemoto S, Finkel T. Mitochondria, oxidants, and aging. Cell. 2005;120:483–495. - PubMed
-
- Kroemer G, Reed JC. Mitochondrial control of cell death. Nat. Med. 2000;6:513–519. - PubMed
-
- Anderson S, Bankier AT, Barrell BG, de Bruijn MH, Coulson AR, Drouin J, Eperon IC, Nierlich DP, Roe BA, Sanger F, et al. Sequence and organization of the human mitochondrial genome. Nature. 1981;290:457–465. - PubMed
-
- Mancuso M, Orsucci D, LoGerfo A, Calsolaro V, Siciliano G. Clinical features and pathogenesis of Alzheimer's disease: involvement of mitochondria and mitochondrial DNA. Adv. Exp. Med. Biol. 2010;685:34–44. - PubMed
Publication types
MeSH terms
Substances
Grants and funding
LinkOut - more resources
Full Text Sources
Other Literature Sources
