Impact of insulin deprivation and treatment on sphingolipid distribution in different muscle subcellular compartments of streptozotocin-diabetic C57Bl/6 mice
- PMID: 24368672
- PMCID: PMC3948970
- DOI: 10.1152/ajpendo.00610.2012
Impact of insulin deprivation and treatment on sphingolipid distribution in different muscle subcellular compartments of streptozotocin-diabetic C57Bl/6 mice
Abstract
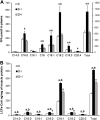
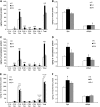
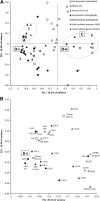
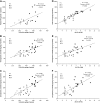
Insulin deprivation in type 1 diabetes (T1D) individuals increases lipolysis and plasma free fatty acids (FFA) concentration, which can stimulate synthesis of intramyocellular bioactive lipids such as ceramides (Cer) and long-chain fatty acid-CoAs (LCFa-CoAs). Ceramide was shown to decrease muscle insulin sensitivity, and at mitochondrial levels it stimulates reactive oxygen species production. Here, we show that insulin deprivation in streptozotocin diabetic C57BL/6 mice increases quadriceps muscle Cer content, which was correlated with a concomitant decrease in the body fat and increased plasma FFA, glycosylated hemoglobin level (%Hb A1c), and muscular LCFa-CoA content. The alternations were accompanied by an increase in protein expression in LCFa-CoA and Cer synthesis (FATP1/ACSVL5, CerS1, CerS5), a decrease in the expression of genes implicated in muscle insulin sensitivity (GLUT4, GYS1), and inhibition of insulin signaling cascade by Aktα and GYS3β phosphorylation under acute insulin stimulation. Both the content and composition of sarcoplasmic fraction sphingolipids were most affected by insulin deprivation, whereas mitochondrial fraction sphingolipids remained stable. The observed effects of insulin deprivation were reversed, except for content and composition of LCFa-CoA, CerS protein expression, GYS1 gene expression, and phosphorylation status of Akt and GYS3β when exogenous insulin was provided by subcutaneous insulin implants. Principal component analysis and Pearson's correlation analysis revealed close relationships between the features of the diabetic phenotype, the content of LCFa-CoAs and Cers containing C18-fatty acids in sarcoplasm, but not in mitochondria. Insulin replacement did not completely rescue the phenotype, especially regarding the content of LCFa-CoA, or proteins implicated in Cer synthesis and muscle insulin sensitivity. These persistent changes might contribute to muscle insulin resistance observed in T1D individuals.
Keywords: ceramide; long-chain fatty acid-coenzyme A; mitochondria; skeletal muscle; type 1 diabetes.
Figures


Similar articles
-
Comparison of Two Modern Survival Prediction Tools, SORG-MLA and METSSS, in Patients With Symptomatic Long-bone Metastases Who Underwent Local Treatment With Surgery Followed by Radiotherapy and With Radiotherapy Alone.Clin Orthop Relat Res. 2024 Dec 1;482(12):2193-2208. doi: 10.1097/CORR.0000000000003185. Epub 2024 Jul 23. Clin Orthop Relat Res. 2024. PMID: 39051924
-
Depressing time: Waiting, melancholia, and the psychoanalytic practice of care.In: Kirtsoglou E, Simpson B, editors. The Time of Anthropology: Studies of Contemporary Chronopolitics. Abingdon: Routledge; 2020. Chapter 5. In: Kirtsoglou E, Simpson B, editors. The Time of Anthropology: Studies of Contemporary Chronopolitics. Abingdon: Routledge; 2020. Chapter 5. PMID: 36137063 Free Books & Documents. Review.
-
Defining the optimum strategy for identifying adults and children with coeliac disease: systematic review and economic modelling.Health Technol Assess. 2022 Oct;26(44):1-310. doi: 10.3310/ZUCE8371. Health Technol Assess. 2022. PMID: 36321689 Free PMC article.
-
Sphingolipids modulate redox signalling during human sperm capacitation.Hum Reprod. 2024 Dec 10:deae268. doi: 10.1093/humrep/deae268. Online ahead of print. Hum Reprod. 2024. PMID: 39658334
-
The effectiveness of abstinence-based and harm reduction-based interventions in reducing problematic substance use in adults who are experiencing homelessness in high income countries: A systematic review and meta-analysis: A systematic review.Campbell Syst Rev. 2024 Apr 21;20(2):e1396. doi: 10.1002/cl2.1396. eCollection 2024 Jun. Campbell Syst Rev. 2024. PMID: 38645303 Free PMC article. Review.
Cited by
-
Combined training enhances skeletal muscle mitochondrial oxidative capacity independent of age.J Clin Endocrinol Metab. 2015 Apr;100(4):1654-63. doi: 10.1210/jc.2014-3081. Epub 2015 Jan 19. J Clin Endocrinol Metab. 2015. PMID: 25599385 Free PMC article. Clinical Trial.
-
Compartmentalization of Sphingolipid metabolism: Implications for signaling and therapy.Pharmacol Ther. 2022 Apr;232:108005. doi: 10.1016/j.pharmthera.2021.108005. Epub 2021 Sep 25. Pharmacol Ther. 2022. PMID: 34582834 Free PMC article. Review.
-
Reduction of hyperglycemia in STZ-induced diabetic mice by prophylactic treatment with heat-killed Mycobacterium aurum: possible effects on glucose utilization, mitochondrial uncoupling, and oxidative stress in liver and skeletal muscle.Front Endocrinol (Lausanne). 2024 Sep 6;15:1427058. doi: 10.3389/fendo.2024.1427058. eCollection 2024. Front Endocrinol (Lausanne). 2024. PMID: 39377070 Free PMC article.
-
Lactosylceramide contributes to mitochondrial dysfunction in diabetes.J Lipid Res. 2016 Apr;57(4):546-62. doi: 10.1194/jlr.M060061. Epub 2016 Feb 21. J Lipid Res. 2016. PMID: 26900161 Free PMC article.
-
Insulin increases ceramide synthesis in skeletal muscle.J Diabetes Res. 2014;2014:765784. doi: 10.1155/2014/765784. Epub 2014 May 18. J Diabetes Res. 2014. PMID: 24949486 Free PMC article.
References
-
- Alkhateeb H, Chabowski A, Glatz JF, Luiken JF, Bonen A. Two phases of palmitate-induced insulin resistance in skeletal muscle: impaired GLUT4 translocation is followed by a reduced GLUT4 intrinsic activity. Am J Physiol Endocrinol Metab 293: E783–E793, 2007 - PubMed
-
- Beha A, Juretschke HP, Kuhlmann J, Neumann-Haefelin C, Belz U, Gerl M, Kramer W, Roden M, Herling AW. Muscle type-specific fatty acid metabolism in insulin resistance: an integrated in vivo study in Zucker diabetic fatty rats. Am J Physiol Endocrinol Metab 290: E989–E997, 2006 - PubMed
Publication types
MeSH terms
Substances
Grants and funding
LinkOut - more resources
Full Text Sources
Other Literature Sources
Medical

