. 2013;9(10):e1003673.
doi: 10.1371/journal.ppat.1003673. Epub 2013 Oct 17.

Crystal structure of the gamma-2 herpesvirus LANA DNA binding domain identifies charged surface residues which impact viral latency

Affiliations

Crystal structure of the gamma-2 herpesvirus LANA DNA binding domain identifies charged surface residues which impact viral latency

Bruno Correia et al. PLoS Pathog. 2013.

Abstract

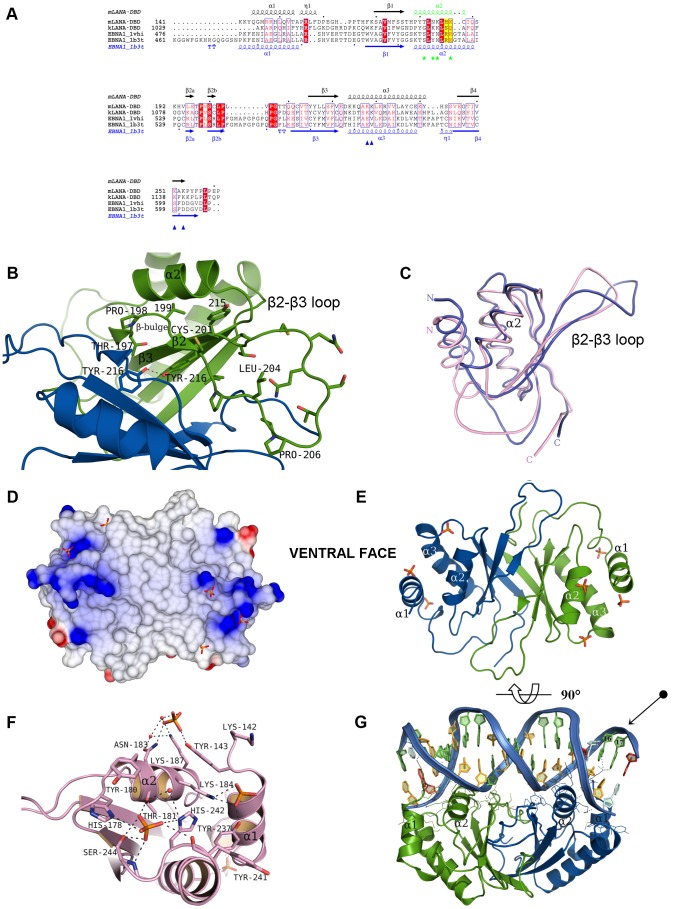
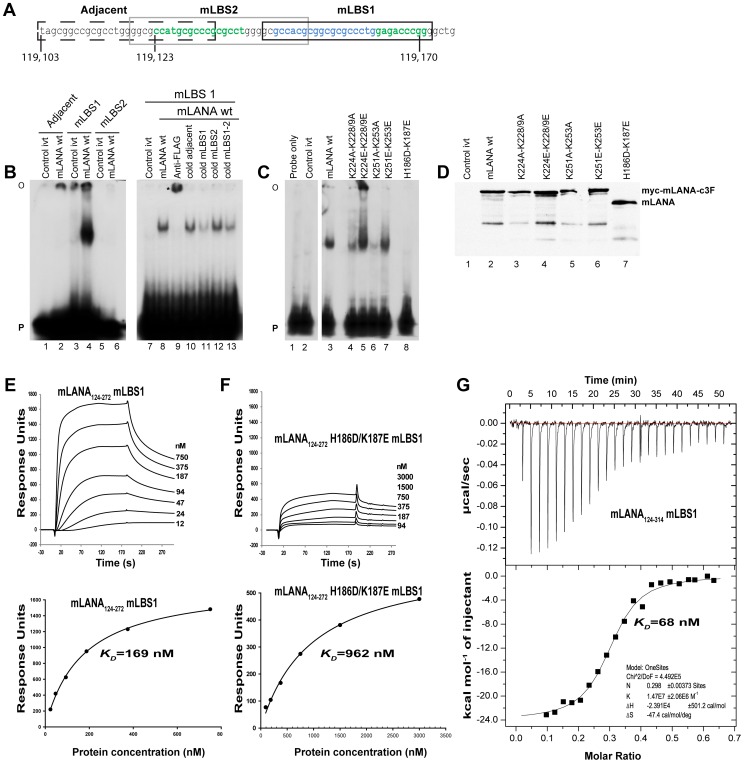
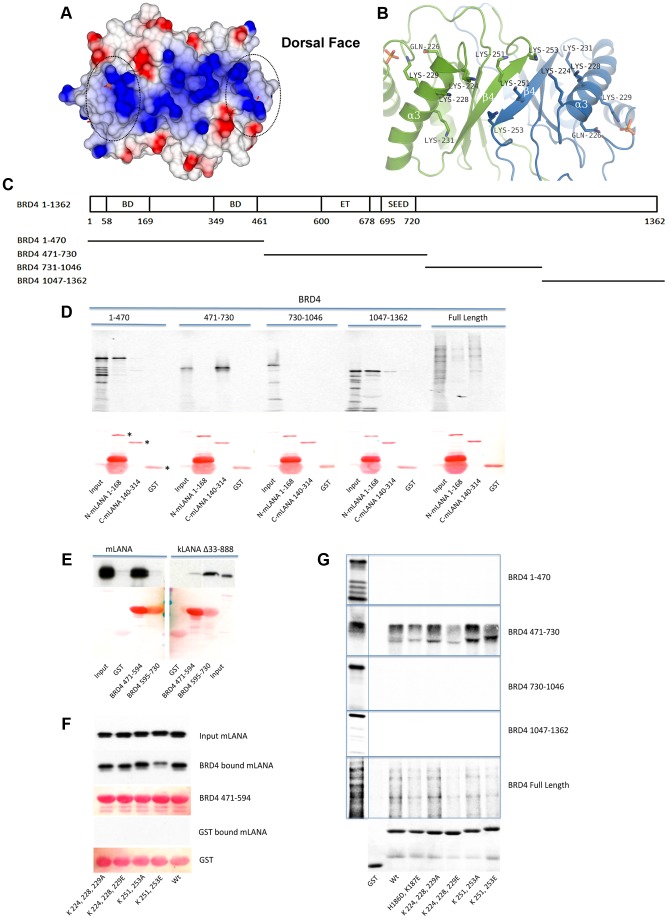
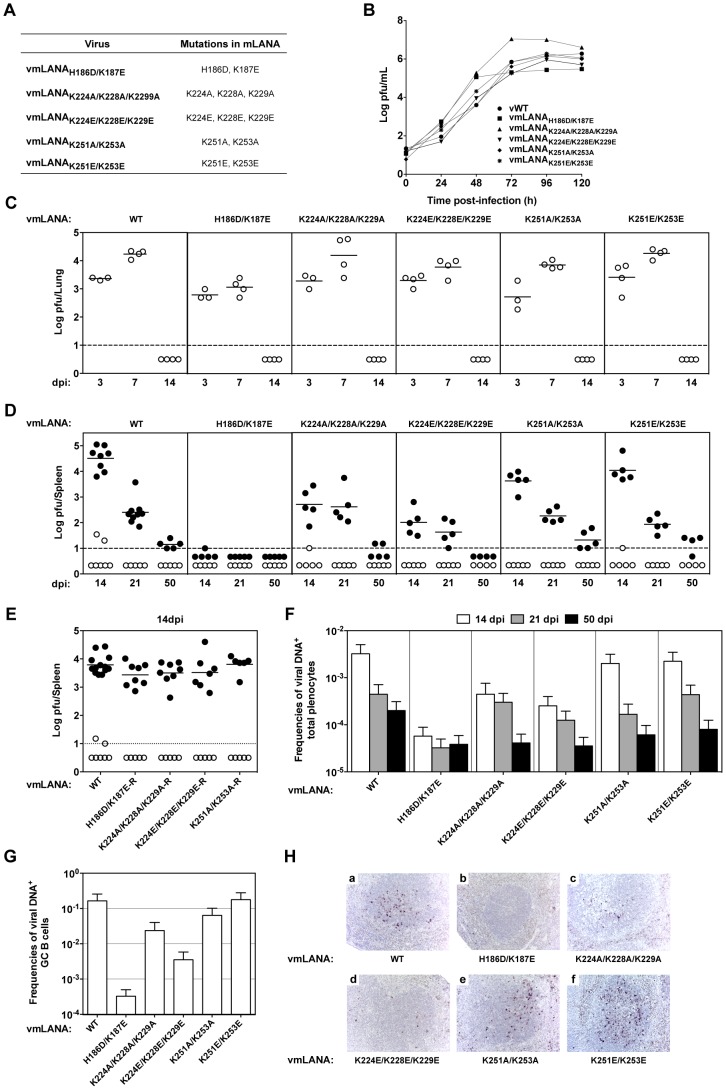
Latency-associated nuclear antigen (LANA) mediates γ2-herpesvirus genome persistence and regulates transcription. We describe the crystal structure of the murine gammaherpesvirus-68 LANA C-terminal domain at 2.2 Å resolution. The structure reveals an alpha-beta fold that assembles as a dimer, reminiscent of Epstein-Barr virus EBNA1. A predicted DNA binding surface is present and opposite this interface is a positive electrostatic patch. Targeted DNA recognition substitutions eliminated DNA binding, while certain charged patch mutations reduced bromodomain protein, BRD4, binding. Virus containing LANA abolished for DNA binding was incapable of viable latent infection in mice. Virus with mutations at the charged patch periphery exhibited substantial deficiency in expansion of latent infection, while central region substitutions had little effect. This deficiency was independent of BRD4. These results elucidate the LANA DNA binding domain structure and reveal a unique charged region that exerts a critical role in viral latent infection, likely acting through a host cell protein(s).


Conflict of interest statement

The authors have declared that no competing interests exist.

Figures

Figure 1
Figure 1. Structure of the C-terminal domain of mLANA.
(A) A ribbon representation with secondary structure assignment for a monomer of the MHV-68 mLANA140–272 DNA-binding domain (see also Figure S1). (B) A representation of the mLANA140–272 quaternary structure and its dimeric conformation viewed along the non-crystallographic axis and illustrates the α-helical arrangement around the β-barrel core. The two chains are coloured in blue (chain A) and green (chain B). (C) Cross section of the dimer interface with coloured surface properties. A large area (∼1440 Å2) constituting the hydrophobic core is displayed in yellow with the hydrogen bonding residues displayed in blue. Deleting residues P254–P259 in red from the C-terminus destabilizes the dimer, as it contributes to the hydrophobic stability of the dimer interface (see also Figure S2). (D) Fluorescence-based thermal shift analysis of mLANA truncations (arrows display the midpoint of the unfolding transitions). The midpoint melting temperatures of the protein-unfolding transition (Tm) for mLANA DBD truncations are shown for the optimal buffers. (E) mLANA tetramer assembly presumed for cooperative TR DNA binding as observed in the crystal packing with the symmetry equivalent dimer. Phosphate interactions coordinate the dimer-dimer interface. Two dimers form a tetramer stabilized by an interface with a surface area (∼535 Å2) per monomer that is approximately 12% of that of the total surface of a single subunit (∼7,500 Å2). (F) A ribbon representation of the dimer-dimer interface view from the ventral side. In the interface Arg-148 from dimer-2 stacks against Tyr-241, and makes a weak hydrogen bond with Tyr-237 from dimer-1. The arginine residue is conserved in both mLANA and kLANA proteins which has the ability to intercalate between hydrophobic aromatic amino acids on the second dimer.
Figure 2
Figure 2. Conserved sequence and structural features of mLANA.
(A) Structure based sequence alignment of the MHV-68 mLANA DBD with the DBD domains of KSHV kLANA, EBV EBNA1 (PDB ID: 1VHI), and EBNA1 DNA complex (PDB ID: 1B3T). The secondary structure of mLANA DBD is shown above the alignment while the secondary structure elements of EBNA1 structure are labelled below (blue). The recognition helix α2 is coloured in green with key residues highlighted. The recognition helix residues His-186 and Lys-187 are marked in yellow. Green stars indicate the residues of the recognition helix that interacted with phosphate ions. Conserved dorsal residues with positive charge are indicated by blue triangles. Figure is made with ESPript (http://espript.ibcp.fr/ESPript/ESPript/) Key: Red boxes and white characters indicate strict identity, red characters indicate similarity in a group and blue frames indicate similarity across groups. (B) Representation of the dimer interface on the ventral side highlighting the conformation of the β2–β3 SOCS box loop. The β2–β3 loop is the proposed hydrophobic interface for Elongin C interaction and shows the accessibility of residues Cys-201 and Leu-204 of the 199 VSCLPLVP 206 SOCS motif, shown as sticks. The interface highlights the conserved hydrogen bond between chain A Tyr-216 (blue) and chain B Tyr-216 (green) and shows the Pro-198 β-bulge. (C) Structural superposition of mLANA140–272 (chain B), in pink, with EBNA1 (PDB ID 1vhi; chain B), in blue (r.m.s deviation = 1.37 Å based on 82 equivalent Cα atoms). The recognition helix α2 in mLANA is shorter when compared to EBNA1 by 4 amino acids (1 helical turn), this has implications for both DNA binding and specificity. (D) mLANA dimer showing the electrostatic surface of the ventral side, the proposed DNA binding site and highlights five of the phosphate binding sites that trace DNA interactions. Electrostatic surface of mLANA was calculated and displayed using CCP4mg. The surface potentials displayed scale from −0.5 V (red, negatively charged) to +0.5 V (blue, positively charged). (E) A ribbon representation of the dimer in the same orientation, showing the secondary structure arrangement. (F) Representation of the recognition helix α2 and the key residues which interacts with 3 different phosphates through the side-chains of residues His-178, Thr-181, Asn-183, Lys-184 and Lys-187. (G) Structural model of a mLANA DBD DNA complex (rotated relative to panel E) using mLBS1 DNA docked onto the 18 bp EBNA1 DNA recognition sequence followed by energy minimisation using YASARA. The DNA shown was that which gave the best minimized score as indicated in Figure S3. In the structure each nucleotide is drawn in a different colour for clarity, adenine (red), guanine (green), cytosine (lightorange), and thymine (lightblue). The arrow indicates specific nucleotide interactions at sequence 16 and 17 of the modelled TR DNA.
Figure 3
Figure 3. mLANA binds TR DNA with nanomolar affinity.
(A) MHV-68 TR sequence with genomic coordinates is shown. Oligonucleotide sequences used for gel shift analyses are boxed. Sequence protected by DNAse I footprint analysis is shown in blue and green. (B) mLBS1, mLBS2 or control adjacent 32P-labeled oligonucleotides were each incubated with in vitro-translated mLANAc3F wt or control reticulocyte lysate (control ivt). Anti-FLAG antibody, or 50 fold excess unlabeled (cold) competitor were included in incubations where indicated. FLAG antibody supershifted complex is indicated by an asterisk. (C) mLBS1 32P-labeled oligonucleotide was incubated alone (lane 1), with control reticulocyte lysate (lane 2; control ivt), or the indicated in vitro-translated mLANA proteins. O, gel origin; P, free probe. (D) Western Blot is shown containing the same in vitro-translated mLANA proteins as in (C). (E and F) Panels show the SPR difference sensorgram with increasing concentrations of protein. Protein concentrations injected are as labelled. A 3-min association was followed by a 3-min dissociation phase. The bottom panels represent the K D determination. The binding constant obtained by Langmuir fit of wild-type and mutant data sets using a 1∶1 stoichiometry-binding model. (G) ITC binding profile of mLANA124–314 with mLBS1 at 25°C. Top panel show raw differential power signals recorded versus time for 30 µM of mLBS1 titrations injected into a cell containing 8.5 µM of mLANA124–314 dimer. Bottom panel show integrated injection heats versus the molar ratio of mLANA to mLBS1. Kinetic parameters obtained from the experiments are given in Table 3.
Figure 4
Figure 4. The dorsal face of mLANA and its role in BRD4 binding.
(A) Electrostatic surface showing the residues that contribute to the positive electrostatic potential, Arg-156, Lys-224, 225, 228, 229, 231, and Arg-232, which run along the spine of the dorsal face. The QAKKLK motif is highlighted. The scale is from −0.5 V (red, negatively charged) to +0.5 V (blue, positively charged). (B) Ribbon diagram highlighting the key positively charged residues. (C) Schematic diagram of BRD4 and fragments used for mapping the mLANA binding. BD, bromodomain; ET, extra-terminal domain; SEED, conserved region consists of polyserine (S) residues interspersed with glutamic (E) and aspartic (D) acid residues , . (D) BRD4 fragments were labelled with [35S]-methionine and assayed for binding to GST mLANA 1–168 or GST mLANA 140–314. Ponceau S detection of proteins (lower panel) is shown and full length GST, GST mLANA 1–168, or GST mLANA 140–314 are indicated with asterisks. (E) Western blots for mLANA and kLANA are shown in the upper panel; the Ponceau S stained GST and GST fusion proteins are displayed in the lower panel. Despite the lower intensity of the GST and GST BRD4 595–730 bands after Ponceau S staining, Coomassie blue staining (Figure S4) showed that similar amounts of fusion proteins were present. (F) After incubation with GST or GST BRD4 471–594, bound mLANA was detected by FLAG immunoblot. Ponceau S staining of fusion proteins is shown. (G) BRD4 or BRD4 fragments labelled with [35S]-methionine were assayed for binding to GST mLANA 124–272 or GST mLANA 124–272 containing substitution mutations. Coomassie blue staining of fusion proteins is shown in the bottom panel.
Figure 5
Figure 5. mLANA DNA binding is essential for virus persistence and the dorsal positive patch exerts a role in the expansion of GC B cells.
(A) Amino acid substitutions in recombinant viruses (see also Figure S5). (B) Infection of BHK-21 cells at 0.01 p.f.u. per cell. Virus titres were determined by plaque assay. (C) Lungs from infected mice were removed and infectious viruses were titrated by plaque assay. (D and E) Quantification of latent infection in spleen by explant co-culture plaque assay (closed circles). Titres of infectious virus were determined in freeze/thawed splenocyte suspensions (open circles). Each circle represents the titre of an individual mouse. The dashed line represents the limit of detection of the assay. Mutant viruses are shown in panel D and revertant viruses in panel E. (F and G) Reciprocal frequencies of viral DNA-positive cells in total splenocytes (F) or GC B cells (CD19+CD95hiGL7hi) (G) were determined by limiting dilution and real-time PCR. Data were obtained from pools of five spleens per group. Bars represent the frequency of viral DNA-positive cells with 95% confidence intervals. (H) Identification of latently infected cells in spleens by in situ hybridization. Representative splenic sections from each group of viruses are shown. All images are magnified ×200. Dark staining indicates cells positive for virally encoded miRNAs (see also Table 4).

Similar articles

Cited by

References

    1. Simas JP, Efstathiou S (1998) Murine gammaherpesvirus 68: a model for the study of gammaherpesvirus pathogenesis. Trends Microbiol 6: 276–282. - PubMed
    1. Speck SH, Ganem D (2010) Viral latency and its regulation: lessons from the gamma-herpesviruses. Cell Host Microbe 8: 100–115. - PMC - PubMed
    1. Nash AA, Dutia BM, Stewart JP, Davison AJ (2001) Natural history of murine gamma-herpesvirus infection. Philos Trans R Soc Lond B Biol Sci 356: 569–579. - PMC - PubMed
    1. Cardin RD, Brooks JW, Sarawar SR, Doherty PC (1996) Progressive loss of CD8+ T cell-mediated control of a gamma-herpesvirus in the absence of CD4+ T cells. J Exp Med 184: 863–871. - PMC - PubMed
    1. Sunil-Chandra NP, Efstathiou S, Nash AA (1992) Murine gammaherpesvirus 68 establishes a latent infection in mouse B lymphocytes in vivo. J Gen Virol 73 Pt 12: 3275–3279. - PubMed

Publication types