. 2013 Oct;123(10):4479-88.
doi: 10.1172/JCI69589. Epub 2013 Sep 16.

Inhibiting glycolytic metabolism enhances CD8+ T cell memory and antitumor function

Inhibiting glycolytic metabolism enhances CD8+ T cell memory and antitumor function

Madhusudhanan Sukumar et al. J Clin Invest. 2013 Oct.

Abstract

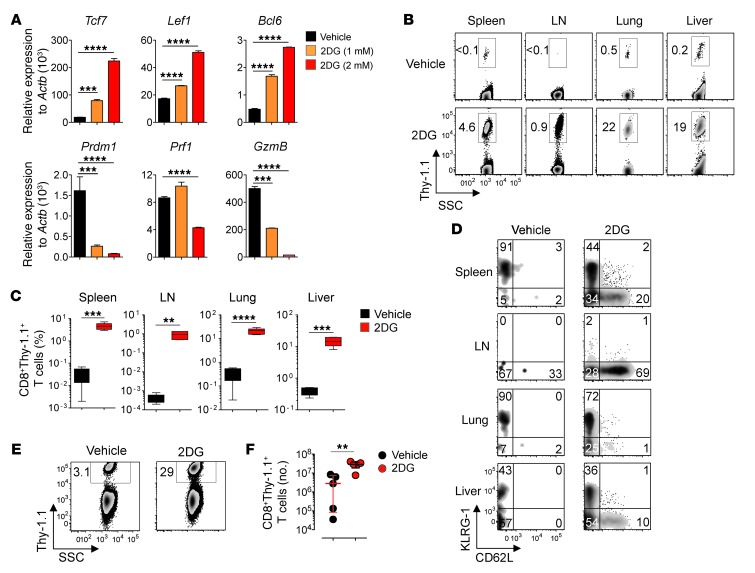
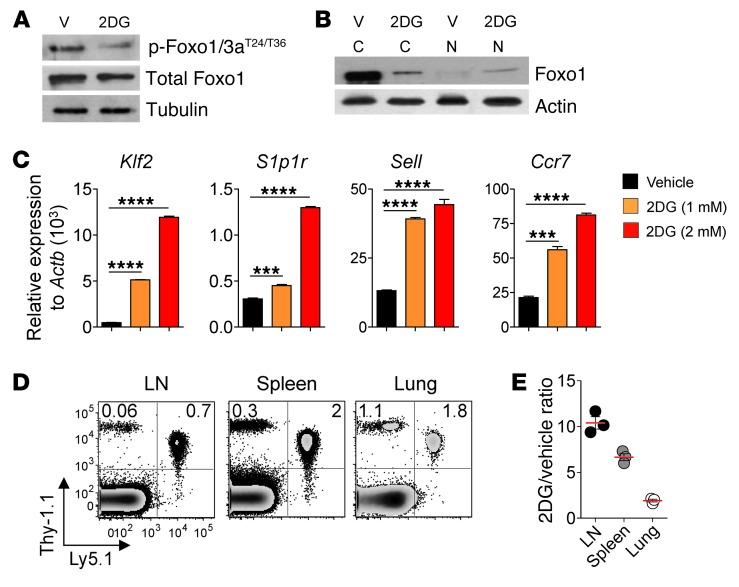
Naive CD8+ T cells rely upon oxidation of fatty acids as a primary source of energy. After antigen encounter, T cells shift to a glycolytic metabolism to sustain effector function. It is unclear, however, whether changes in glucose metabolism ultimately influence the ability of activated T cells to become long-lived memory cells. We used a fluorescent glucose analog, 2-NBDG, to quantify glucose uptake in activated CD8+ T cells. We found that cells exhibiting limited glucose incorporation had a molecular profile characteristic of memory precursor cells and an increased capacity to enter the memory pool compared with cells taking up high amounts of glucose. Accordingly, enforcing glycolytic metabolism by overexpressing the glycolytic enzyme phosphoglycerate mutase-1 severely impaired the ability of CD8+ T cells to form long-term memory. Conversely, activation of CD8+ T cells in the presence of an inhibitor of glycolysis, 2-deoxyglucose, enhanced the generation of memory cells and antitumor functionality. Our data indicate that augmenting glycolytic flux drives CD8+ T cells toward a terminally differentiated state, while its inhibition preserves the formation of long-lived memory CD8+ T cells. These results have important implications for improving the efficacy of T cell-based therapies against chronic infectious diseases and cancer.


Figures

Figure 1
Figure 1. CD8+ T cells undergo metabolic reprogramming upon activation and differentiation.
(A) Quantitative RT-PCR analysis of Cpt1a and Hk2 expression in pmel-1 CD8+ T cells at the indicated times after T cell stimulation. Results are presented relative to Actb. Data are mean ± SEM of 3 measurements. (B) Relative abundance of key metabolites involved in FAO and glycolysis in pmel-1 CD8+ Tn and Teff subsets. Data are mean ± SEM of 6 independently generated samples. G-6-P, glucose 6 phosphate; PEP, phosphoenolpyruvate. (C) OCR and ECAR of pmel-1 CD8+ Tns and Teffs. Data are mean ± SEM of 4 measurements. **P < 0.01, ***P < 0.001, ****P < 0.0001, 2-tailed Student’s t test. Results in A and C are representative of 3 independent experiments.
Figure 2
Figure 2. Glucose uptake segregates short-lived Teffs from memory T cell precursors.
(AD) Flow cytometry sort (A), 2DG uptake (B), ECAR (C), OCR/ECAR ratio (D),and quantitative RT-PCR analysis of key memory and effector genes (E) in 2-NBDGlo and 2-NBDGhi Teffs. Data are mean ± SEM of 4 (BD) or 3 (E) measurements. Results in E are presented relative to Actb. (F and G) Flow cytometry analysis (F) and numbers (G) of CD8+ Thy-1.1+ T cells on the indicated days after adoptive transfer of 2 × 10⁵ 2-NBDGhi and 2-NBDGlo cells into wild-type mice and subsequent infection with gp100-VV. Density plots in F are shown after gating on CD8+ cells. Numbers represent percent cells in the respective gates. Data in G are mean ± SEM of 3–6 samples. **P < 0.01, ***P < 0.001, ****P < 0.0001, 2-tailed Student’s t test (BE) or 2-way ANOVA (G). Data are representative of 5 (A), 3 (E), or 2 (BD, F, and G) independent experiments.
Figure 3
Figure 3. Enforced glycolytic flux limits long-term survival of CD8+ T cells.
(A) Flow cytometry post-sort analysis of GFP expression in pmel-1 CD8+ T cells transduced with a retrovirus encoding empty GFP control or Pgam1 GFP. (B) Radiolabeled 2DG uptake in control and Pgam1-transduced CD8+ T cells. (C and D) ECAR (C) and OCR/ECAR ratio (D) of control and Pgam1-transduced CD8+ T cells. Data are mean ± SEM of 4 measurements. (E and F) Flow cytometry analysis (E) and frequency (F) of CD8+GFP+ T cells 30 days after adoptive transfer of 1 × 10⁵ control and Pgam1-transduced CD8+ T cells into wild-type mice and subsequent infection with gp100-VV. Density plots in E are shown after gating on CD8+ cells. Numbers represent percent cells in the GFP+ gate. Data in E are mean ± SEM of 3 samples. (G and H) Flow cytometry analysis (G) and number (H) of CD8+GFP+ T cells in mice as in E and F, 5 days after heterologous vaccination with ad-gp100. Density plots in G are shown after gating on CD8+ cells. Numbers represent percent cells in the GFP+ gate. *P < 0.05, **P < 0.01, 1-tailed (C and D) or 2-tailed (B, F, and H) Student’s t test. Data are representative of 5 (A) or 2 (BH) independent experiments.
Figure 4
Figure 4. Inhibition of glycolysis triggers activation of energy stress signaling, which reinforces glycolysis shutdown.
(A) ECAR and OCR/ECAR ratio of CD8+ T cells activated by antibodies specific to CD3 and CD28 in the presence of 2DG (2 mM) or DMSO vehicle. Data are mean ± SEM of 4 measurements. (B) Immunoblot analysis of p-AMPK and Hif1-α protein in cells as in A. β-actin was used as a loading control. (C) Quantitative RT-PCR analysis of the expression of glycolytic enzymes in CD8+ T cells. Results are presented relative to Actb. Tpi, triose phosphate isomerase; Pkm2, pyruvate kinase muscle; Slc16a3, solute carrier family 16, member 3; Ldha, lactate dehydrogenase A. Data are mean ± SEM of 3 measurements. *P < 0.05, **P < 0.01, ***P < 0.001, ****P < 0.0001, 1-tailed (A, OCR/ECAR) or 2-tailed (A, ECAR, and C) Student’s t test. Data are representative of 3 (C) or 2 (A and B) independent experiments.
Figure 5
Figure 5. Inhibition of glycolysis enhances memory CD8+ T cell formation.
(A) Quantitative RT-PCR analysis of the expression of key memory and effector genes in pmel-1 CD8+ T cells 4 days after activation in the presence of 2DG or vehicle (culture media). Results are presented relative to Actb. Data are mean ± SEM of 3 measurements. (BD) Flow cytometry analysis (B and D) and frequency (C) of CD8+Thy-1.1+ T cells 40 days after adoptive transfer of 106 pmel-1 CD8+Thy-1.1+ T cells, generated as in A, into wild-type mice and subsequent infection with gp100-VV. Density plots are shown after gating on CD8+ (B) or CD8+Thy-1.1+ (D) cells. Numbers represent percent cells in the Thy-1.1+ gate (B) or respective quadrants (D). Data in C are mean ± SEM of 3–4 samples. (E and F) Flow cytometry analysis (E) and numbers (F) of CD8+Thy-1.1+ T cells in mice treated as in BD, 5 days after heterologous vaccination with ad-gp100. Density plots in E are shown after gating on CD8+ cells. Numbers represent percent cells in the Thy-1.1+ gate. **P < 0.01, ***P < 0.001, ****P < 0.0001, 2-tailed Student’s t test. Data are representative of 3 (A) or 2 (BF) independent experiments.
Figure 6
Figure 6. Blockade of glycolysis reprograms CD8+ T cell migration.
(A) Immunoblot analysis of phosphorylated Foxo1/3a proteins in pmel-1 CD8+ T cells 4 days after activation in the presence of 2DG or vehicle (culture media). Tubulin was used as a loading control. (B) Immunoblot analysis of Foxo1 protein in isolated fractions of CD8+ T cells activated for 24 hours in the presence of 2DG or vehicle. β-actin was used as a loading control. (C) Quantitative RT-PCR analysis of Klf2, S1p1r, Sell, and Ccr7 expression in pmel-1 CD8+ T cells as in A. Results are presented relative to Actb. Data are mean ± SEM of 3 measurements. (D and E) Flow cytometry analysis (D) and Ly5.1+Thy-1.1+/Thy-1.1+ ratio (E) of CD8+ T cells in the lymph nodes, spleen, and lungs 24 hours after adoptive transfer of 1:1 mix of 106 Ly5.1+Thy-1.1+ (2DG-treated) and Thy-1.1+ (vehicle) pmel-1 CD8+ T cells into wild-type mice. Flow cytometry in D is shown after gating on CD8+ cells. Numbers represent percent cells in the respective quadrants. Data in E are mean ± SEM. ***P < 0.001, ****P < 0.0001, 2-tailed Student’s t test. Data are representative of 3 (C) or 2 (A, B, D, and E) independent experiments.
Figure 7
Figure 7. Inhibition of glycolysis during ex vivo expansion enhances the antitumor function of CD8+ T cells.
(A) Flow cytometry analysis of CD8+ Thy-1.1+ T cells in the tumor at the indicated times after adoptive transfer of 106 pmel-1 CD8+ Thy-1.1+ T cells generated in vitro in the presence of 2DG or vehicle (culture media) into sublethally irradiated B16-tumor bearing mice after gp100-VV vaccination and exogenous IL-2. Numbers represent percent CD8+ Thy-1.1+ cells. (B) Quantitative RT-PCR analysis of Slc2a1 and Pkm2 expression in pmel-1 CD8+ T cells isolated from tumors 5 days after adoptive transfer as in A. Results are presented relative to Actb. Data are mean ± SEM of 3 measurements. (C) Percent IFN-γ– and TNF-α–producing pmel-1 CD8+ Thy-1.1+ cells isolated from spleens 5 days after adoptive transfer as in A. (D and E) Tumor size (D) and survival (E) of sublethally irradiated B16 tumor-bearing mice as in A. Data are mean ± SEM of 5 samples. *P < 0.05, **P < 0.01, 2-tailed Student’s t test (B and C) or log-rank (Mantel-Cox) test (E). Data are representative of 2 independent experiments.

Comment in

Similar articles

Cited by

References

    1. Williams MA, Bevan MJ. Effector and memory CTL differentiation. Annu Rev Immunol. 2007;25:171–192. doi: 10.1146/annurev.immunol.25.022106.141548. - DOI - PubMed
    1. Klebanoff CA, Gattinoni L, Restifo NP. CD8+ T-cell memory in tumor immunology and immunotherapy. Immunol Rev. 2006;211:214–224. doi: 10.1111/j.0105-2896.2006.00391.x. - DOI - PMC - PubMed
    1. Gattinoni L, Klebanoff CA, Restifo NP. Paths to stemness: building the ultimate antitumour T cell. Nat Rev Cancer. 2012;12(10):671–684. doi: 10.1038/nrc3322. - DOI - PMC - PubMed
    1. Gattinoni L, et al. Wnt signaling arrests effector T cell differentiation and generates CD8+ memory stem cells. Nat Med. 2009;15(7):808–813. doi: 10.1038/nm.1982. - DOI - PMC - PubMed
    1. Gattinoni L, et al. A human memory T cell subset with stem cell-like properties. Nat Med. 2011;17(10):1290–1297. doi: 10.1038/nm.2446. - DOI - PMC - PubMed

Publication types

MeSH terms