Mitochondrial reactive oxygen species induces NLRP3-dependent lysosomal damage and inflammasome activation
- PMID: 24089192
- PMCID: PMC3833073
- DOI: 10.4049/jimmunol.1301490
Mitochondrial reactive oxygen species induces NLRP3-dependent lysosomal damage and inflammasome activation
Abstract
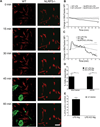
The nucleotide-binding oligomerization domain-like receptor family, pyrin domain-containing 3 (NLRP3) inflammasome drives many inflammatory processes and mediates IL-1 family cytokine release. Inflammasome activators typically damage cells and may release lysosomal and mitochondrial products into the cytosol. Macrophages triggered by the NLRP3 inflammasome activator nigericin show reduced mitochondrial function and decreased cellular ATP. Release of mitochondrial reactive oxygen species (ROS) leads to subsequent lysosomal membrane permeabilization (LMP). NLRP3-deficient macrophages show comparable reduced mitochondrial function and ATP loss, but maintain lysosomal acidity, demonstrating that LMP is NLRP3 dependent. A subset of wild-type macrophages undergo subsequent mitochondrial membrane permeabilization and die. Both LMP and mitochondrial membrane permeabilization are inhibited by potassium, scavenging mitochondrial ROS, or NLRP3 deficiency, but are unaffected by cathepsin B or caspase-1 inhibitors. In contrast, IL-1β secretion is ablated by potassium, scavenging mitochondrial ROS, and both cathepsin B and caspase-1 inhibition. These results demonstrate interplay between lysosomes and mitochondria that sustain NLRP3 activation and distinguish cell death from IL-1β release.
Conflict of interest statement
The authors declare no conflict of interest.
Figures


Similar articles
-
Inflammasome activation by mitochondrial oxidative stress in macrophages leads to the development of angiotensin II-induced aortic aneurysm.Arterioscler Thromb Vasc Biol. 2015 Jan;35(1):127-36. doi: 10.1161/ATVBAHA.114.303763. Epub 2014 Nov 6. Arterioscler Thromb Vasc Biol. 2015. PMID: 25378412
-
The anti-tumorigenic mushroom Agaricus blazei Murill enhances IL-1β production and activates the NLRP3 inflammasome in human macrophages.PLoS One. 2012;7(7):e41383. doi: 10.1371/journal.pone.0041383. Epub 2012 Jul 23. PLoS One. 2012. PMID: 22844468 Free PMC article.
-
NLRP3 inflammasome signaling is activated by low-level lysosome disruption but inhibited by extensive lysosome disruption: roles for K+ efflux and Ca2+ influx.Am J Physiol Cell Physiol. 2016 Jul 1;311(1):C83-C100. doi: 10.1152/ajpcell.00298.2015. Epub 2016 May 11. Am J Physiol Cell Physiol. 2016. PMID: 27170638 Free PMC article.
-
The role of lysosomal cysteine cathepsins in NLRP3 inflammasome activation.Arch Biochem Biophys. 2019 Jul 30;670:32-42. doi: 10.1016/j.abb.2019.02.015. Epub 2019 Feb 23. Arch Biochem Biophys. 2019. PMID: 30807742 Review.
-
Redox regulation of NLRP3 inflammasomes: ROS as trigger or effector?Antioxid Redox Signal. 2015 May 1;22(13):1111-29. doi: 10.1089/ars.2014.5994. Epub 2015 Jan 19. Antioxid Redox Signal. 2015. PMID: 25330206 Free PMC article. Review.
Cited by
-
Ferroptosis is induced following siramesine and lapatinib treatment of breast cancer cells.Cell Death Dis. 2016 Jul 21;7(7):e2307. doi: 10.1038/cddis.2016.208. Cell Death Dis. 2016. PMID: 27441659 Free PMC article.
-
Unraveling the Link Between Mitochondrial Dynamics and Neuroinflammation.Front Immunol. 2021 Mar 16;12:624919. doi: 10.3389/fimmu.2021.624919. eCollection 2021. Front Immunol. 2021. PMID: 33796100 Free PMC article. Review.
-
PKC/ROS-Mediated NLRP3 Inflammasome Activation Is Attenuated by Leishmania Zinc-Metalloprotease during Infection.PLoS Negl Trop Dis. 2015 Jun 26;9(6):e0003868. doi: 10.1371/journal.pntd.0003868. eCollection 2015. PLoS Negl Trop Dis. 2015. PMID: 26114647 Free PMC article.
-
Lactic Acid Fermentation Is Required for NLRP3 Inflammasome Activation.Front Immunol. 2021 Mar 29;12:630380. doi: 10.3389/fimmu.2021.630380. eCollection 2021. Front Immunol. 2021. PMID: 33854503 Free PMC article.
-
α-Hemolysin of uropathogenic E. coli regulates NLRP3 inflammasome activation and mitochondrial dysfunction in THP-1 macrophages.Sci Rep. 2020 Jul 28;10(1):12653. doi: 10.1038/s41598-020-69501-1. Sci Rep. 2020. PMID: 32724079 Free PMC article.
References
-
- Petrilli V, Dostert C, Muruve DA, Tschopp J. The inflammasome: a danger sensing complex triggering innate immunity. Curr Opin Immunol. 2007;19:615–622. - PubMed
-
- Agostini L, Martinon F, Burns K, McDermott MF, Hawkins PN, Tschopp J. NALP3 forms an IL-1beta-processing inflammasome with increased activity in Muckle-Wells autoinflammatory disorder. Immunity. 2004;20:319–325. - PubMed
Publication types
MeSH terms
Substances
Grants and funding
LinkOut - more resources
Full Text Sources
Other Literature Sources
Molecular Biology Databases

