Kaposi's sarcoma-associated herpesvirus microRNA single-nucleotide polymorphisms identified in clinical samples can affect microRNA processing, level of expression, and silencing activity
- PMID: 24006441
- PMCID: PMC3807933
- DOI: 10.1128/JVI.01202-13
Kaposi's sarcoma-associated herpesvirus microRNA single-nucleotide polymorphisms identified in clinical samples can affect microRNA processing, level of expression, and silencing activity
Abstract
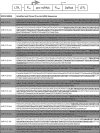
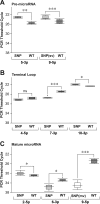
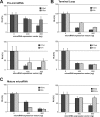
Kaposi's sarcoma-associated herpesvirus (KSHV) encodes 12 pre-microRNAs that can produce 25 KSHV mature microRNAs. We previously reported single-nucleotide polymorphisms (SNPs) in KSHV-encoded pre-microRNA and mature microRNA sequences from clinical samples (V. Marshall et al., J. Infect. Dis., 195:645-659, 2007). To determine whether microRNA SNPs affect pre-microRNA processing and, ultimately, mature microRNA expression levels, we performed a detailed comparative analysis of (i) mature microRNA expression levels, (ii) in vitro Drosha/Dicer processing, and (iii) RNA-induced silencing complex-dependent targeting of wild-type (wt) and variant microRNA genes. Expression of pairs of wt and variant pre-microRNAs from retroviral vectors and measurement of KSHV mature microRNA expression by real-time reverse transcription-PCR (RT-PCR) revealed differential expression levels that correlated with the presence of specific sequence polymorphisms. Measurement of KSHV mature microRNA expression in a panel of primary effusion lymphoma cell lines by real-time RT-PCR recapitulated some observed expression differences but suggested a more complex relationship between sequence differences and expression of mature microRNA. Furthermore, in vitro maturation assays demonstrated significant SNP-associated changes in Drosha/DGCR8 and/or Dicer processing. These data demonstrate that SNPs within KSHV-encoded pre-microRNAs are associated with differential microRNA expression levels. Given the multiple reports on the involvement of microRNAs in cancer, the biological significance of these phenotypic and genotypic variants merits further studies in patients with KSHV-associated malignancies.
Figures


Similar articles
-
Kaposi's Sarcoma-Associated Herpesvirus MicroRNAs Target GADD45B To Protect Infected Cells from Cell Cycle Arrest and Apoptosis.J Virol. 2017 Jan 18;91(3):e02045-16. doi: 10.1128/JVI.02045-16. Print 2017 Feb 1. J Virol. 2017. PMID: 27852859 Free PMC article.
-
Kaposi's sarcoma-associated herpesvirus microRNAs repress breakpoint cluster region protein expression, enhance Rac1 activity, and increase in vitro angiogenesis.J Virol. 2015 Apr;89(8):4249-61. doi: 10.1128/JVI.03687-14. Epub 2015 Jan 28. J Virol. 2015. PMID: 25631082 Free PMC article.
-
Discovery of Kaposi's sarcoma herpesvirus-encoded circular RNAs and a human antiviral circular RNA.Proc Natl Acad Sci U S A. 2018 Dec 11;115(50):12805-12810. doi: 10.1073/pnas.1816183115. Epub 2018 Nov 19. Proc Natl Acad Sci U S A. 2018. PMID: 30455306 Free PMC article.
-
miRNAs and their roles in KSHV pathogenesis.Virus Res. 2019 Jun;266:15-24. doi: 10.1016/j.virusres.2019.03.024. Epub 2019 Apr 2. Virus Res. 2019. PMID: 30951791 Review.
-
KSHV microRNAs: Tricks of the Devil.Trends Microbiol. 2017 Aug;25(8):648-661. doi: 10.1016/j.tim.2017.02.002. Epub 2017 Mar 2. Trends Microbiol. 2017. PMID: 28259385 Free PMC article. Review.
Cited by
-
KSHV miRNAs decrease expression of lytic genes in latently infected PEL and endothelial cells by targeting host transcription factors.Viruses. 2014 Oct 23;6(10):4005-23. doi: 10.3390/v6104005. Viruses. 2014. PMID: 25341664 Free PMC article. Review.
-
Importance of the RNA secondary structure for the relative accumulation of clustered viral microRNAs.Nucleic Acids Res. 2014 Jul;42(12):7981-96. doi: 10.1093/nar/gku424. Epub 2014 May 15. Nucleic Acids Res. 2014. PMID: 24831544 Free PMC article.
-
Genetic variability of microRNA regulome in human.Mol Genet Genomic Med. 2015 Jan;3(1):30-9. doi: 10.1002/mgg3.110. Epub 2014 Sep 15. Mol Genet Genomic Med. 2015. PMID: 25629077 Free PMC article.
-
Viral microRNA genomics and target validation.Curr Opin Virol. 2014 Aug;7:33-9. doi: 10.1016/j.coviro.2014.03.014. Epub 2014 Apr 22. Curr Opin Virol. 2014. PMID: 24763063 Free PMC article. Review.
-
Viral non-coding RNAs: Stealth strategies in the tug-of-war between humans and herpesviruses.Semin Cell Dev Biol. 2021 Mar;111:135-147. doi: 10.1016/j.semcdb.2020.06.015. Epub 2020 Jul 3. Semin Cell Dev Biol. 2021. PMID: 32631785 Free PMC article. Review.
References
-
- Chang Y, Cesarman E, Pessin MS, Lee F, Culpepper J, Knowles DM, Moore PS. 1994. Identification of herpesvirus-like DNA sequences in AIDS-associated Kaposi's sarcoma. Science 266:1865–1869 - PubMed
-
- Cesarman E, Chang Y, Moore PS, Said JW, Knowles DM. 1995. Kaposi's sarcoma-associated herpesvirus-like DNA sequences in AIDS-related body-cavity-based lymphomas. N. Engl. J. Med. 332:1186–1191 - PubMed
-
- Soulier J, Grollet L, Oksenhendler E, Cacoub P, Cazals-Hatem D, Babinet P, d'Agay MF, Clauvel JP, Raphael M, Degos L, Sigaux F. 1995. Kaposi's sarcoma-associated herpesvirus-like DNA sequences in multicentric Castleman's disease. Blood 86:1276–1280 - PubMed
-
- Ambros V. 2004. The functions of animal microRNAs. Nature 431:350–355 - PubMed
-
- Bartel DP. 2004. MicroRNAs: genomics, biogenesis, mechanism, and function. Cell 116:281–297 - PubMed
Publication types
MeSH terms
Substances
Grants and funding
LinkOut - more resources
Full Text Sources
Other Literature Sources

