. 2013 Nov;23(11):1797-809.
doi: 10.1101/gr.151340.112. Epub 2013 Aug 12.

Oncogenic ETS fusions deregulate E2F3 target genes in Ewing sarcoma and prostate cancer

Affiliations

Oncogenic ETS fusions deregulate E2F3 target genes in Ewing sarcoma and prostate cancer

Sven Bilke et al. Genome Res. 2013 Nov.

Abstract

Deregulated E2F transcription factor activity occurs in the vast majority of human tumors and has been solidly implicated in disturbances of cell cycle control, proliferation, and apoptosis. Aberrant E2F regulatory activity is often caused by impairment of control through pRB function, but little is known about the interplay of other oncoproteins with E2F. Here we show that ETS transcription factor fusions resulting from disease driving rearrangements in Ewing sarcoma (ES) and prostate cancer (PC) are one such class of oncoproteins. We performed an integrative study of genome-wide DNA-binding and transcription data in EWSR1/FLI1 expressing ES and TMPRSS2/ERG containing PC cells. Supported by promoter activity and mutation analyses, we demonstrate that a large fraction of E2F3 target genes are synergistically coregulated by these aberrant ETS proteins. We propose that the oncogenic effect of ETS fusion oncoproteins is in part mediated by the disruptive effect of the E2F-ETS interaction on cell cycle control. Additionally, a detailed analysis of the regulatory targets of the characteristic EWSR1/FLI1 fusion in ES identifies two functionally distinct gene sets. While synergistic regulation in concert with E2F in the promoter of target genes has a generally activating effect, EWSR1/FLI1 binding independent of E2F3 is predominantly associated with repressed differentiation genes. Thus, EWSR1/FLI1 appears to promote oncogenesis by simultaneously promoting cell proliferation and perturbing differentiation.


Figures
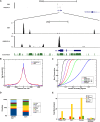
Figure 1.
Figure 1.
Characterization of DNA binding regions. (A) ChIP-seq tag density plot for EWSR1/FLI1 and E2F3: Regions of significantly increased tag densities typically occur as clusters in relatively small, focal regions, with little or no signal between clusters. In an ∼130-kb genomic region (upper plot), increased densities are almost exclusively observed in the immediate vicinity (lower plot) of ID2, a known regulatory target of ETS factors. Both E2F3 as well as EWSR1/FLI1 demonstrate partially overlapping regions of increased tag densities. (B) Increased binding close to transcription start sites: relative number of reads covering regions centered at transcription start sites. Shown is the tag density averaged over all RefSeq annotated transcription start sites normalized to one at a large distance for EWSR1/FLI1 and E2F3 chromatin immunoprecipitations. (C) High conservation of binding regions: fraction of binding regions (abscissa) with a maximal conservation smaller or equal to the value on the ordinate. More than 90% of the E2F3 binding regions had a maximum conservation score >0.5, and in 75% conservation reached the maximum value of one. EWSR1/FLI1 binding regions, too, show a high degree of conservation, regardless of whether they are located within proximal promoter regions or in distal regions. As a reference, the random curve estimates the behavior of unselected regions in the genome. (D,E) Gene compartments. (D) Distribution of binding events with respect to RefSeq gene annotations: In comparison to E2F3, a significantly larger proportion of EWSR1/FLI1 binding occurs in intergenic (>4k from closest gene) and intronic regions. (E) Enrichment of binding events in gene compartments estimated by comparison to randomized binding demonstrates a very strong promoter bias for E2F3 binding, and to a somewhat lesser extent, EWSR1/FLI1. The latter is in part explained by colocalization of both factors. EWSR1/FLI1 binding regions not overlapping with E2F3 demonstrate only weak promoter bias.
Figure 2.
Figure 2.
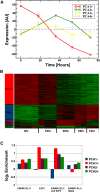
Transcription factor binding and gene expression changes in response to shRNA-induced knockdown of EWSR1/FLI1. (A) The first four principal components of the knockdown-induced expression changes. Each component represents one coherent, dominant pattern of expression changes. Only the first three components show a significant nonzero signal; thus, only these three components were used in the subsequent analysis. (B) Heatmap of expression level changes of genes significantly (r > 0.8) correlated (+) and anti-correlated (−) with principal components 1 and 2. Due to their relatively low number, genes correlated with PCA3 are not visible in this diagram. (C) Compared with a flat background model, E2F3 and EWSR1/FLI1 binding regions are enriched adjacent to genes with expression changes correlated to the two largest principal components. Both factors overlap, and this association is generally stronger, with the notable exception of PCA1: Colocalization of both factors is underrepresented among genes rapidly up-regulated in response to EWSR1/FLI1 knockdown. Also, EWSR1/FLI1 binding in distal regions is underrepresented in the group of responders following PCA1+.
Figure 3.
Figure 3.
In silico analysis of binding regions. (A,B) Overrepresented transcription factor recognition sequences within binding regions of EWSR1/FLI1 and E2F3, respectively. The set of motifs shown in B has been selected in order to reduce redundancies between similar motifs. A complete list can be found in the Supplemental Material (Supplemental Table S3). (C) Binding frequency is correlated with the presence of ETS and E2F binding motifs in the promoter DNA sequence: Shown is the frequency of binding events of E2F3, EWSR1/FLI1, or both factors simultaneously (i.e., the average number of binding events per promoter). In this analysis promoters were subdivided into four groups, containing either E2F or ETS, neither, or both motifs. The group containing none of the two motifs was used for normalization, setting the frequency to one. Expanding the analysis to include the relative organization of ETS and E2F motifs in regions containing both motifs, it becomes apparent (D) that the effective binding affinity depends on that organization. The number of experimentally observed binding events (y-axis) overlapping any given ETS motif in the genome depends on the oriented distance (x-axis) from that ETS motif to the next E2F motif. (E) Specific spatial arrangements of ETS and E2F recognition sites are overrepresented in E2F3 and EWSR1/FLI binding regions. The plot displays the frequency of spatial configurations of ETS and E2F motifs within ChIP-seq binding regions of EWSR1/FLI1 and E2F3. Besides a global maximum at close distances, as expected in promoter regions with an overall increase of recognition sequences, discrete regions of increased frequency of pairs of E2F and ETS factors are visible. As a reference, scales for lengths 80 bp (length of one internucleosomal linker) and 146 bp (length of nucleosomal DNA) are also displayed in the graph. The frequency measurements depicted in D and E can best be interpreted as conditional probabilities, where D shows the probability to observe binding given that there is a specific geometric organization of the binding sites, while E shows the probability of finding a specific geometry, given that there is a binding event. Even though these two observations are related by Bayes' theorem, they are mutually independent, as discussed in detail in the Supplemental Material.
Figure 4.
Figure 4.
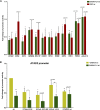
Promoter binding and activity of genomic EWSR1/FLI1 and E2F3 binding regions. (A) Firefly luciferase reporter assays for 10 arbitrarily chosen genes identified by ChIP-seq as EWSR1/FLI1 and E2F3 target genes. Promoter fragments (CDK2: −122/+458; E2F3: −272/+327; RAD51: −186/+164; VRK1: −269/+100; RFC2: −400/+25; ATAD2: −368/+202; RRM2: −463/+191; GEMIN4: −275/+87; MFLI1P: −251/+70; SKP2: −240/348) were cloned into the pGL4.10 vector (Promega) and tested for responsiveness to conditional EWSR1/FLI1 knockdown in A673 ES cells 48 h after doxycycline-induced EWSR1/FLI1 shRNA induction (dark green) or shRNA-induced knockdown of E2F3 (red). As negative controls, promoter activities of an expressed gene that does not show a change in mRNA expression after the EWSR1/FLI1 knockdown (PRKCI: −139/265), and of the empty vector (pGL4.10) are shown. The y-axis represents the promoter activity relative to control conditions. Means and standard deviations of at least three independent experiments, each performed in triplicate, are shown. (B) Fold changes in reporter activity of wild-type and mutant ATAD2 reporter constructs in the presence (light green) and doxycycline-induced absence (dark green) of EWSR1/FLI1 48 h after EWSR1/FLI1 shRNA induction. See Supplemental Figure S3 for ChIP and luciferase assays.
Figure 5.
Figure 5.
Comparison of ETS factor binding and transcriptional regulation in prostate and ES cells. (A) ERG binding in RWPE and VCaP prostate cells occurs preferentially in regions bound by E2F3 in A673. Shown is the enrichment of ERG or TMPRSS2/ERG binding events in proximity to E2F3 binding regions calculated by comparison to a flat, random background model. Enrichment is even stronger for the component of ERG binding that overlaps that of EWSR1/FLI-1 in A673. (B) The occupancy by E2F3 in the promoter of E2F3 and GEMIN4 is significantly reduced in the models for ES (A673) and prostate cancer (VCaP) for promoters with a mutated ETS recognition site in comparison to wild-type sequence. In HeLa cells, mutation of the ETS recognition site does not significantly change E2F3 binding. (C) Enrichment of ETS fusion and E2F3 binding in proximity to genes positively regulated by the fusions in their respective cells (right half) and for binding events shared across A673 and VCaP cells (left). Shown is the enrichment of such genes positively regulated by ETS in VCaP (yellow), A673 (orange), or in the set of genes responsive in both cell types (blue). (D) Read densities in the promoter region of a representative ETS responsive cell cycle gene RFC4 illustrating similarity of overlapping binding by TMPRSS2/ERG and EWSR1/FLI1 with E2F3 in VCaP and A673 cells. See Supplemental Figure S5 for transcription factor motif analysis.
Figure 6.
Figure 6.
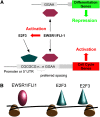
Genomic location and architecture of EWSR1/FLI1 binding regions determine mode of target gene regulation. Two modes of EWSR1/FLI1-driven gene regulation: (A) Binding of EWSR1/FLI1 to distal ETS motifs in the absence of E2F binding results predominantly in target gene repression, while proximal cooperative promoter binding of EWSR1/FLI1 and EWSR1/FLI1 activated E2F3 results in target gene activation. (B) Spatial arrangement of ETS and E2F binding motifs in regions bound by EWSR1/FLI1 and E2F3.

Similar articles

Cited by

References

    1. Chen H-Z, Tsai S-Y, Leone G 2009. Emerging roles of E2Fs in cancer: An exit from cell cycle control. Nat Rev Cancer 9: 785–797 - PMC - PubMed
    1. Clark JP, Cooper CS 2009. ETS gene fusions in prostate cancer. Nat Rev Urol 6: 429–439 - PubMed
    1. De Bleser P, Hooghe B, Vlieghe D, van Roy F 2007. A distance difference matrix approach to identifying transcription factors that regulate differential gene expression. Genome Biol 8: R83. - PMC - PubMed
    1. Delattre O, Zucman J, Plougastel B, Desmaze C, Melot T, Peter M, Kovar H, Joubert I, De Jong P, Rouleau G 1992. Gene fusion with an ETS DNA-binding domain caused by chromosome translocation in human tumours. Nature 359: 162–165 - PubMed
    1. Dennis G Jr, Sherman BT, Hosack DA, Yang J, Gao W, Lane HC, Lempicki RA 2003. DAVID: Database for Annotation, Visualization, and Integrated Discovery. Genome Biol 4: 3 - PubMed

Publication types

MeSH terms

Associated data