. 2013:4:2236.
doi: 10.1038/ncomms3236.

Reductive glutamine metabolism is a function of the α-ketoglutarate to citrate ratio in cells

Affiliations

Reductive glutamine metabolism is a function of the α-ketoglutarate to citrate ratio in cells

Sarah-Maria Fendt et al. Nat Commun. 2013.

Abstract

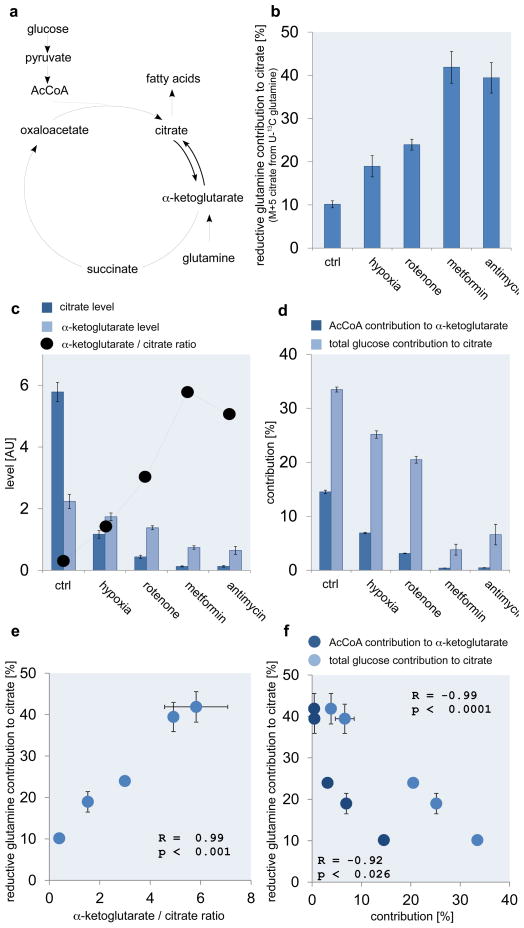
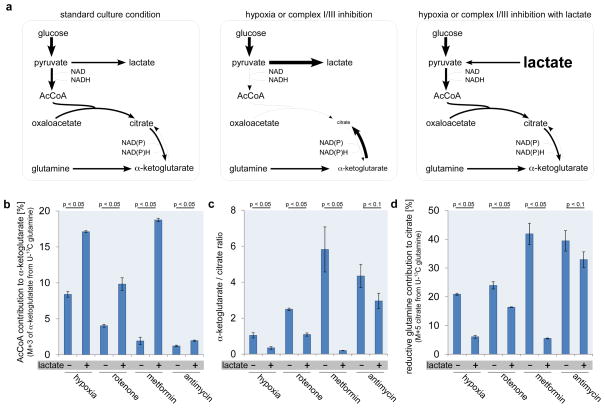
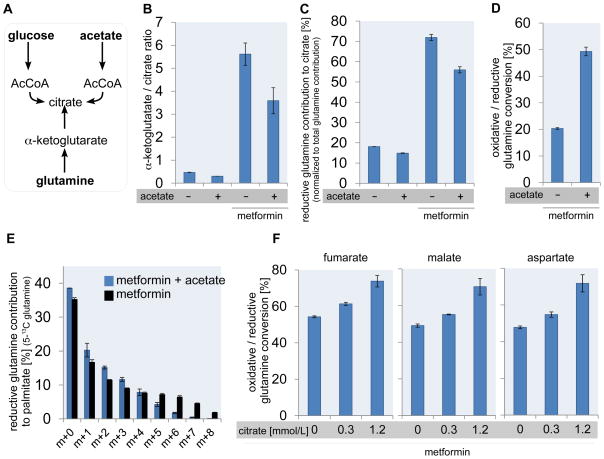
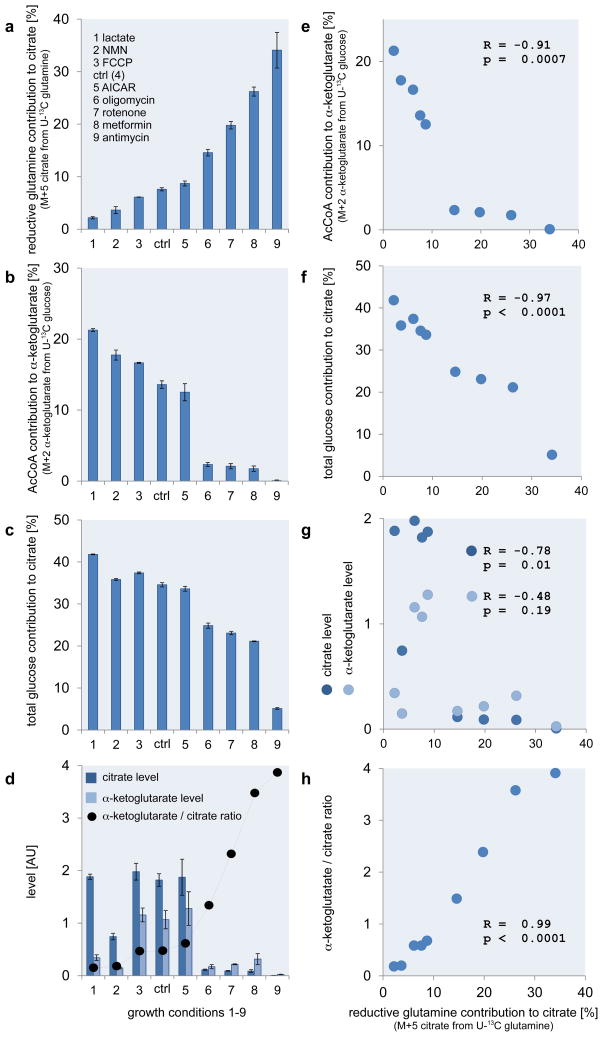
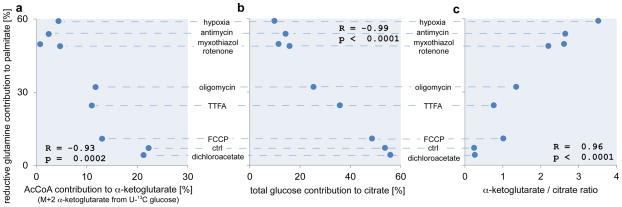
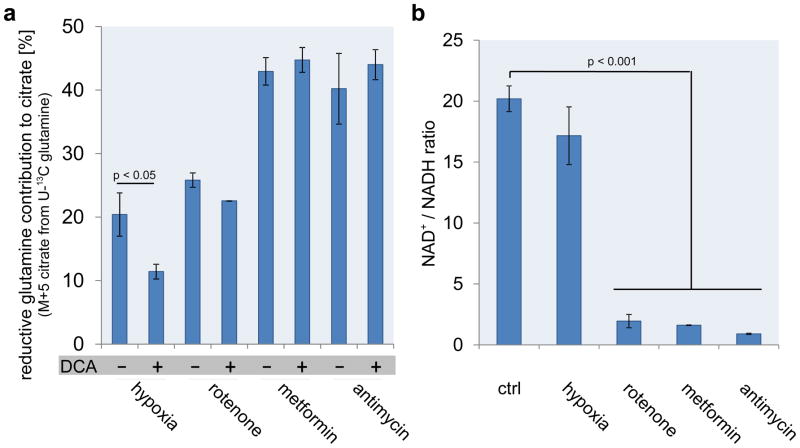
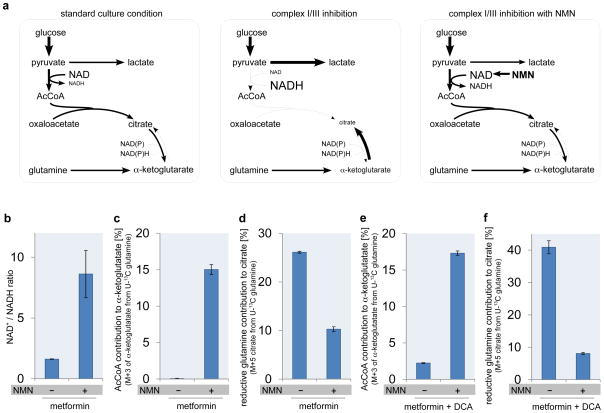
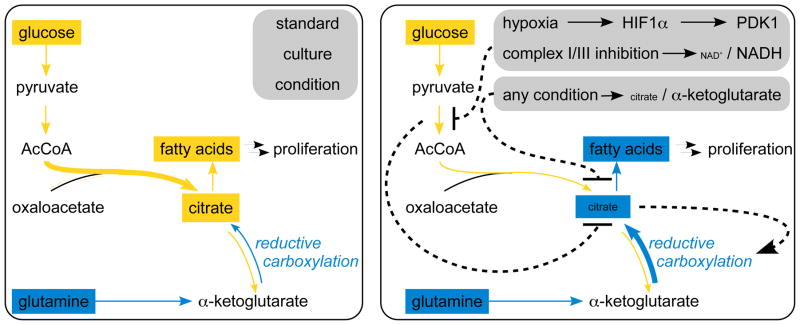
Reductively metabolized glutamine is a major cellular carbon source for fatty acid synthesis during hypoxia or when mitochondrial respiration is impaired. Yet, a mechanistic understanding of what determines reductive metabolism is missing. Here we identify several cellular conditions where the α-ketoglutarate/citrate ratio is changed due to an altered acetyl-CoA to citrate conversion, and demonstrate that reductive glutamine metabolism is initiated in response to perturbations that result in an increase in the α-ketoglutarate/citrate ratio. Thus, targeting reductive glutamine conversion for a therapeutic benefit might require distinct modulations of metabolite concentrations rather than targeting the upstream signalling, which only indirectly affects the process.


Conflict of interest statement

Competing Financial Interests

The authors declare no competing financial interests.

Figures

Figure 1
Figure 1
Reductive carboxylation correlates with concomitant metabolic parameters. (a) Reductive (α-ketoglutarate to citrate) versus oxidative (citrate to α-ketoglutarate) flux and concomitant network reactions and metabolites. Reductive glutamine contribution to citrate (b), alterations in citrate and α-ketoglutarate levels (c), and AcCoA contribution to α-ketoglutarate (M+2 of α-ketoglutarate from U13C glucose) as well as total glucose contribution to citrate (d), for different stress conditions. Correlation between reductive glutamine contribution to citrate and the α-ketoglutarate to citrate ratio (e), and AcCoA contribution to α-ketoglutarate as well as total glucose contribution to citrate (f) Ctrl denotes standard culture condition. All error bars indicate the standard deviation. All p-values (students T-test, two tailed, unequal variance) and error bars are calculated from two independent replicates.
Figure 2
Figure 2
Metabolic parameters modulate reductive carboxylation. (a) Lactate supplementation (25mmol/L) in the media prohibits glucose conversion to lactate and thus forces an increased glucose contribution to the TCA cycle. Flux and metabolite state in standard growth condition (left), hypoxia or complex I/III inhibition (middle), and hypoxia or complex I/III inhibition with lactate (right). Thickness of the arrows and the size of the metabolites indicates the magnitude of alteration. AcCoA contribution to α-ketoglutarate (calculated from a U-13C glutamine tracer: M+3 from glutamine is highly correlated with M+2 from glucose in A549: R= 0.998, p=0.0001) (b), α-ketoglutarate/citrate ratio (c), and reductive glutamine contribution to citrate (d), for different stress conditions with and without lactate supplementation. All error bars indicate the standard deviation. All p-values (students T-test, two tailed, unequal variance) and error bars are calculated from two independent replicates.
Figure 3
Figure 3
The α-ketoglutarate/citrate ratio determines reductive glutamine utilization. (a) Acetate is a third carbon source beside glucose and glutamine that fuels the citrate pool. (b) α-ketoglutarate/citrate ratio, and (c) reductive glutamine contribution to citrate normalized to the total glutamine contribution to citrate, with and without acetate supplementation in the control condition and in the presence of metformin. (d) Ratio of oxidative versus reductive glutamine utilization in the presence of metformin with and without acetate measured with a U13C-glutamine tracer. (e) Glutamine contribution to palmitate in metformin treatment conditions with and without acetate supplementation. (f) Ratio of oxidative versus reductive glutamine utilization in the presence of metformin with and without different concentrations of citrate measured with a U13C-glutamine tracer determined from fumarate, malate and asparate. All error bars indicate the standard deviation. p-values are < 0.05. All p-values (students T-test, two tailed, unequal variance) and error bars are calculated from two independent replicates.
Figure 4
Figure 4
Reductively derived citrate correlates with metabolic parameters in 143B cells. (a) Reductive glutamine contribution to citrate. (b) AcCoA contribution to α-ketoglutarate. (c) Total pyruvate contribution to citrate. (d) Alterations in citrate and α-ketoglutarate levels. Correlation between the reductive glutamine contribution to citrate and (e) the AcCoA contribution to α-ketoglutarate, (f) the total pyruvate contribution to citrate, (g) the relative citrate and α-ketoglutarate levels and (h) the α-ketoglutarate/citrate ratio. In case of lactate supplementation M+3 in α-ketoglutarate from U-13C glutamine instead of M+2 in α-ketoglutarate from U-13C glucose was used. Ctrl denotes standard culture condition. All error bars indicate the standard deviation. The correlation criteria were R > 0.7 or R < −0.7, and p < 0.05. All p-values (students T-test, two tailed, unequal variance) and error bars are calculated from two independent replicates.
Figure 5
Figure 5
Reductively derived fatty acids correlates with metabolic parameters in PC3 cells. Correlation between the reductive glutamine contribution to fatty acids (palmitate) and (a) the AcCoA contribution to α-ketoglutarate, (b) the total glucose contribution to citrate, and (c) the α-ketoglutarate/citrate ratio. Ctrl denotes standard culture condition. All p-values are calculated with students T-test (two tailed, unequal variance).
Figure 6
Figure 6
PDK1 regulates carbon entry into the TCA cycle in hypoxia. (a) Reductive glutamine contribution to citrate for different stress conditions with and without the pyruvate dehydrogenase kinase (PDK) inhibitor DCA. (b) NAD+/NADH ratio for different stress conditions. Ctrl denotes standard culture condition. All error bars indicate the standard deviation. All p-values (students T-test, two tailed, unequal variance) and error bars are calculated from three independent replicates.
Figure 7
Figure 7
NAD+/NADH ratio limits carbon entry into the TCA cycle. (a) NMN supplementation (25mmol/L) increased NAD+ level and thus increased NAD+/NADH ratio, which leads to increased glucose flux through pyruvate dehydrogenase. Flux and metabolite state in standard growth condition (left), hypoxia or complex I/III inhibition (middle), and hypoxia or complex I/III inhibition with NMN (right). Thickness of the arrows and the size of the metabolites indicate the magnitude of alteration. NAD+/NADH ratio (b), AcCoA contribution to α-ketoglutarate (c), reductive glutamine contribution to citrate (d), in the presence of metformin with and without NMN supplementation. AcCoA contribution to α-ketoglutarate (e), and reductive glutamine contribution to citrate (f), in the presence of metformin and pyruvate dehydrogenase kinase inhibitor DCA with and without NMN supplementation. All error bars indicate the standard deviation. P-values between with and without NMN supplementation are < 0.05. All p-values (students T-test, two tailed, unequal variance) and error bars are calculated from two independent replicates.
Figure 8
Figure 8
Reductive glutamine carboxylation is a function of the α-ketoglutarate to citrate ratio. In standard growth conditions proliferation relevant fatty acids are produced mainly from glucose (left). Any stress condition leading to an increased α-ketoglutarate to citrate ratio alters glutamine conversion from oxidative to reductive (right). Subsequently, proliferation relevant fatty acids are produced mainly from glutamine (right). Dashed lines indicate the regulatory flow. Size of the metabolites and arrow thickness indicate the magnitude of alteration.

Similar articles

Cited by

References

    1. Lunt SY, Vander Heiden MG. Aerobic Glycolysis: Meeting the Metabolic Requirements of Cell Proliferation. Annu Rev Cell Dev Biol. 2011;27:441–464. - PubMed
    1. Vander Heiden MG, Cantley LC, Thompson CB. Understanding the Warburg effect: the metabolic requirements of cell proliferation. Science. 2009;324:1029–1033. - PMC - PubMed
    1. Ward Patrick S, Thompson Craig B. Metabolic Reprogramming: A Cancer Hallmark Even Warburg Did Not Anticipate. Cancer Cell. 2012;21:297–308. - PMC - PubMed
    1. Daye D, Wellen KE. Metabolic reprogramming in cancer: Unraveling the role of glutamine in tumorigenesis. Semin Cell Dev Biol. 2012;23(4):362–369. - PubMed
    1. Metallo CM, Gameiro Pa, Bell EL, Mattaini KR, Yang J, Hiller K, et al. Reductive glutamine metabolism by IDH1 mediates lipogenesis under hypoxia. Nature. 2011;481:380–384. - PMC - PubMed

Publication types