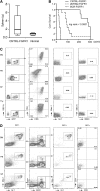
Dysregulated signaling pathways in the development of CNTRL-FGFR1-induced myeloid and lymphoid malignancies associated with FGFR1 in human and mouse models
- PMID: 23777766
- PMCID: PMC3739028
- DOI: 10.1182/blood-2013-03-489823
Dysregulated signaling pathways in the development of CNTRL-FGFR1-induced myeloid and lymphoid malignancies associated with FGFR1 in human and mouse models
Abstract
Myeloid and lymphoid neoplasm associated with FGFR1 is an aggressive disease, and resistant to all the current chemotherapies. To define the molecular etiology of this disease, we have developed murine models of this disease, in syngeneic hosts as well as in nonobese diabetic/severe combined immunodeficiency/interleukin 2Rγ(null) mice engrafted with transformed human CD34+ hematopoietic stem/progenitor cells. Both murine models mimic the human disease with splenohepatomegaly, hypercellular bone marrow, and myeloproliferative neoplasms that progresses to acute myeloid leukemia. Molecular genetic analyses of these model mice, as well as primary human disease, demonstrated that CNTRL-FGFR1, through abnormal activation of several signaling pathways related to development and differentiation of both myeloid and T-lymphoid cells, contribute to overt leukemogenesis. Clonal evolution analysis indicates that myeloid related neoplasms arise from common myeloid precursor cells that retain potential for T-lymphoid differentiation. These data indicate that simultaneously targeting these pathways is essential to successfully treating this almost invariably lethal disease.
Figures


Similar articles
-
Development of ZMYM2-FGFR1 driven AML in human CD34+ cells in immunocompromised mice.Int J Cancer. 2016 Aug 15;139(4):836-40. doi: 10.1002/ijc.30100. Epub 2016 May 4. Int J Cancer. 2016. PMID: 27005999 Free PMC article.
-
A truncated derivative of FGFR1 kinase cooperates with FLT3 and KIT to transform hematopoietic stem cells in syndromic and de novo AML.Mol Cancer. 2022 Jul 29;21(1):156. doi: 10.1186/s12943-022-01628-3. Mol Cancer. 2022. PMID: 35906694 Free PMC article.
-
Constitutive Notch pathway activation in murine ZMYM2-FGFR1-induced T-cell lymphomas associated with atypical myeloproliferative disease.Blood. 2011 Jun 23;117(25):6837-47. doi: 10.1182/blood-2010-07-295725. Epub 2011 Apr 28. Blood. 2011. PMID: 21527531 Free PMC article.
-
Myeloproliferative neoplasms with t(8;22)(p11.2;q11.2)/BCR-FGFR1: a meta-analysis of 20 cases shows cytogenetic progression with B-lymphoid blast phase.Hum Pathol. 2017 Jul;65:147-156. doi: 10.1016/j.humpath.2017.05.008. Epub 2017 May 24. Hum Pathol. 2017. PMID: 28551329 Review.
-
Myeloid and lymphoid neoplasm with abnormalities of FGFR1 presenting with trilineage blasts and RUNX1 rearrangement: a case report and review of literature.Am J Clin Pathol. 2015 May;143(5):738-48. doi: 10.1309/AJCPUD6W1JLQQMNA. Am J Clin Pathol. 2015. PMID: 25873510 Review.
Cited by
-
RHOA-regulated IGFBP2 promotes invasion and drives progression of BCR-ABL1 chronic myeloid leukemia.Haematologica. 2023 Jan 1;108(1):122-134. doi: 10.3324/haematol.2022.280757. Haematologica. 2023. PMID: 35833297 Free PMC article.
-
Mechanisms of resistance to FGFR1 inhibitors in FGFR1-driven leukemias and lymphomas: implications for optimized treatment.Cancer Drug Resist. 2021;4(3):607-619. doi: 10.20517/cdr.2021.30. Epub 2021 May 25. Cancer Drug Resist. 2021. PMID: 34734169 Free PMC article.
-
Fibroblast growth factor receptor fusions in cancer: opportunities and challenges.J Exp Clin Cancer Res. 2021 Nov 3;40(1):345. doi: 10.1186/s13046-021-02156-6. J Exp Clin Cancer Res. 2021. PMID: 34732230 Free PMC article. Review.
-
Oncogenic FGFR Fusions Produce Centrosome and Cilia Defects by Ectopic Signaling.Cells. 2021 Jun 9;10(6):1445. doi: 10.3390/cells10061445. Cells. 2021. PMID: 34207779 Free PMC article. Review.
-
CCDC88C-FLT3 gene fusion in CD34-positive haematopoietic stem and multilineage cells in myeloid/lymphoid neoplasm with eosinophilia.J Cell Mol Med. 2022 Feb;26(3):950-952. doi: 10.1111/jcmm.17143. Epub 2022 Jan 12. J Cell Mol Med. 2022. PMID: 35019216 Free PMC article. No abstract available.
References
-
- Jackson CC, Medeiros LJ, Miranda RN. 8p11 myeloproliferative syndrome: a review. Hum Pathol. 2010;41(4):461–476. - PubMed
-
- Roumiantsev S, Krause DS, Neumann CA, et al. Distinct stem cell myeloproliferative/T lymphoma syndromes induced by ZNF198-FGFR1 and BCR-FGFR1 fusion genes from 8p11 translocations. Cancer Cell. 2004;5(3):287–298. - PubMed
Publication types
MeSH terms
Substances
Associated data
- Actions
Grants and funding
LinkOut - more resources
Full Text Sources
Other Literature Sources
Medical
Molecular Biology Databases
Miscellaneous

