. 2013 Aug;87(16):9041-52.
doi: 10.1128/JVI.00541-13. Epub 2013 Jun 12.

Autocrine CCL3 and CCL4 induced by the oncoprotein LMP1 promote Epstein-Barr virus-triggered B cell proliferation

Affiliations

Autocrine CCL3 and CCL4 induced by the oncoprotein LMP1 promote Epstein-Barr virus-triggered B cell proliferation

Shu-Chun Tsai et al. J Virol. 2013 Aug.

Abstract

Epstein-Barr virus (EBV) alters the regulation and expression of a variety of cytokines in its host cells to modulate host immune surveillance and facilitate viral persistence. Using cytokine antibody arrays, we found that, in addition to the cytokines reported previously, two chemotactic cytokines, CCL3 and CCL4, were induced in EBV-infected B cells and were expressed at high levels in all EBV-immortalized lymphoblastoid cell lines (LCLs). Furthermore, EBV latent membrane protein 1 (LMP1)-mediated Jun N-terminal protein kinase activation was responsible for upregulation of CCL3 and CCL4. Inhibition of CCL3 and CCL4 in LCLs using a short hairpin RNA approach or by neutralizing antibodies suppressed cell proliferation and caused apoptosis, indicating that autocrine CCL3 and CCL4 are required for LCL survival and growth. Importantly, significant amounts of CCL3 were detected in EBV-positive plasma from immunocompromised patients, suggesting that EBV modulates this chemokine in vivo. This study reveals the regulatory mechanism and a novel function of CCL3 and CCL4 in EBV-infected B cells. CCL3 might be useful as a therapeutic target in EBV-associated lymphoproliferative diseases and malignancies.


Figures
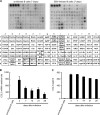
Fig 1
Fig 1
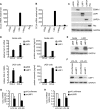
EBV infection induces CCL3 and CCL4 production. CD19-positive B cells were purified and then infected with EBV strain B95.8 or left uninfected. Supernatants of the cells were collected and subjected to cytokine array analysis at day 7 postinfection (A). At the time points indicated, the RNA and supernatants of the cells were collected to detect the amounts of CCL3 and CCL4. CCL3 (B) and CCL4 (C) mRNA levels were measured by RT-qPCR. The relative fold changes in CCL3 and CCL4 mRNA levels were derived by normalizing the CCL3 or CCL4 level of each sample to its GAPDH level and then standardized to that in uninfected B cells. Secreted CCL3 (D) and CCL4 (E) proteins in the culture supernatants were quantified by ELISA. The CCL3 (F) and CCL4 (G) protein concentrations in the culture supernatants of 13 different LCLs were determined by ELISA. The results represent the amount of CCL3 or CCL4 (ng/ml) per 1 × 10⁶ cells. AgRP, agouti-related protein; bEGF, basic epidermal growth factor; b-NGF, nerve growth factor b subunit; BTC, betacellulin; CTACK, cutaneous cell-attracting chemokine; EGF-R, epidermal growth factor receptor; ENA-78, neutrophil-activating protein 78; FGF-4, fibroblast growth factor 4; GCSF, granulocyte colony-stimulating factor; GITR, glucocorticoid-induced tumor necrosis factor receptor; HCC-4, liver-expressed chemokine; HGF, hepatocyte growth factor; IGFBP-6, insulin-like growth factor binding protein 6; IGF-1 SR, insulin-like growth factor 1 SR; I-TAC, interferon-inducible T cell alpha chemoattractant; MIF, migration inhibition factor; NT-4, neurotrophin 4; PIGF, placental growth factor; sTNF RII, tumor necrosis factor RII.
Fig 1
Fig 1
EBV infection induces CCL3 and CCL4 production. CD19-positive B cells were purified and then infected with EBV strain B95.8 or left uninfected. Supernatants of the cells were collected and subjected to cytokine array analysis at day 7 postinfection (A). At the time points indicated, the RNA and supernatants of the cells were collected to detect the amounts of CCL3 and CCL4. CCL3 (B) and CCL4 (C) mRNA levels were measured by RT-qPCR. The relative fold changes in CCL3 and CCL4 mRNA levels were derived by normalizing the CCL3 or CCL4 level of each sample to its GAPDH level and then standardized to that in uninfected B cells. Secreted CCL3 (D) and CCL4 (E) proteins in the culture supernatants were quantified by ELISA. The CCL3 (F) and CCL4 (G) protein concentrations in the culture supernatants of 13 different LCLs were determined by ELISA. The results represent the amount of CCL3 or CCL4 (ng/ml) per 1 × 10⁶ cells. AgRP, agouti-related protein; bEGF, basic epidermal growth factor; b-NGF, nerve growth factor b subunit; BTC, betacellulin; CTACK, cutaneous cell-attracting chemokine; EGF-R, epidermal growth factor receptor; ENA-78, neutrophil-activating protein 78; FGF-4, fibroblast growth factor 4; GCSF, granulocyte colony-stimulating factor; GITR, glucocorticoid-induced tumor necrosis factor receptor; HCC-4, liver-expressed chemokine; HGF, hepatocyte growth factor; IGFBP-6, insulin-like growth factor binding protein 6; IGF-1 SR, insulin-like growth factor 1 SR; I-TAC, interferon-inducible T cell alpha chemoattractant; MIF, migration inhibition factor; NT-4, neurotrophin 4; PIGF, placental growth factor; sTNF RII, tumor necrosis factor RII.
Fig 2
Fig 2
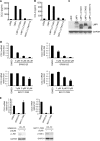
EBV-encoded LMP1 mediates the induction of CCL3 and CCL4. TW01 cells were transfected with 2 μg plasmids expressing EBNA1, LMP1, LMP2A, and Rta and their control vector, pSG5. After 48 h, RNA and proteins were extracted from the cells and used for RT-qPCR to quantify the amounts of the CCL3 (A) and CCL4 (B) transcripts. The relative fold changes in CCL3 and CCL4 mRNA levels were determined by normalizing the CCL3 or CCL4 level of each transfectant to its GAPDH level and then to that in vector control cells. Protein expression was confirmed for each transfectant by Western blotting (C). Akata and L428 cells were transduced with LMP1 or its vector control, pSIN, by lentivirus infection at a multiplicity of infection of 4. At 5 days postinfection, RNA and supernatants were collected (D) for detection of CCL3 and CCL4 as described above and LMP1 expression was determined (E). Two LCLs were transduced with shRNAs of LMP1 or luciferase by lentivirus infection. After 5 days, the cells were selected with 10 μg/ml puromycin for 1 week. The efficiency of LMP1 knockdown was verified by Western blotting (F), and the transcripts of CCL3 (G) and CCL4 (H) were quantified by RT-qPCR.
Fig 3
Fig 3
LMP1-activated signaling pathways transactivate CCL3 and CCL4 promoters. Akata cells (1 × 10⁶) were transduced with LMP1, LMP1 with a CTAR1 deletion (LMP1ΔCTAR1), LMP1 with a CTAR2 deletion (LMP1ΔCTAR2), LMP1 with both CTAR1 and CTAR2 deletions (LMP1ΔCTAR1+2), or the vector control, pSIN, by lentivirus infection at a multiplicity of infection of 4. At 5 days postinfection, supernatants from the cells were collected for detection of CCL3 (A) and CCL4 (B). (C) Expression of LMP1 protein and LMP1 deletion mutants in the cells was confirmed by Western blotting. (D and E) LCL-32 was treated with SP600125 or BAY11-7082 at the indicated concentrations for 48 h. The CCL3 and CCL4 transcripts were quantified by RT-qPCR, and the relative fold expression of CCL3 and CCL4 was normalized to the amounts of CCL3 and CCL4 transcripts in dimethyl sulfoxide (DMSO)-treated cells. The expression of phosphorylated JNK, phosphorylated IκB-α, and GAPDH was detected by Western blotting. (F to I) Schematic illustration of the CCL3 and CCL4 promoters that drive the expression of the luciferase gene in the reporter plasmids. Predicted transcription factor binding sites in the region are labeled. HEK293T cells were transfected with LMP1-expressing plasmid or the vector control in combination with pCCL3 (F) or pCCL4 (G) reporter plasmids with serial deletions at the 5′ end and pEGFP-C1 as a transfection control. After 72 h, the relative luciferase activity of each transfectant was normalized to its GFP intensity and standardized to that of the vector control cells. In addition, HEK293T transfectants were treated with SP600125 or dimethyl sulfoxide for 48 h. The relative luciferase activity of each transfectant was normalized to its GFP intensity and standardized to that of the vector control cells (H and I).
Fig 3
Fig 3
LMP1-activated signaling pathways transactivate CCL3 and CCL4 promoters. Akata cells (1 × 10⁶) were transduced with LMP1, LMP1 with a CTAR1 deletion (LMP1ΔCTAR1), LMP1 with a CTAR2 deletion (LMP1ΔCTAR2), LMP1 with both CTAR1 and CTAR2 deletions (LMP1ΔCTAR1+2), or the vector control, pSIN, by lentivirus infection at a multiplicity of infection of 4. At 5 days postinfection, supernatants from the cells were collected for detection of CCL3 (A) and CCL4 (B). (C) Expression of LMP1 protein and LMP1 deletion mutants in the cells was confirmed by Western blotting. (D and E) LCL-32 was treated with SP600125 or BAY11-7082 at the indicated concentrations for 48 h. The CCL3 and CCL4 transcripts were quantified by RT-qPCR, and the relative fold expression of CCL3 and CCL4 was normalized to the amounts of CCL3 and CCL4 transcripts in dimethyl sulfoxide (DMSO)-treated cells. The expression of phosphorylated JNK, phosphorylated IκB-α, and GAPDH was detected by Western blotting. (F to I) Schematic illustration of the CCL3 and CCL4 promoters that drive the expression of the luciferase gene in the reporter plasmids. Predicted transcription factor binding sites in the region are labeled. HEK293T cells were transfected with LMP1-expressing plasmid or the vector control in combination with pCCL3 (F) or pCCL4 (G) reporter plasmids with serial deletions at the 5′ end and pEGFP-C1 as a transfection control. After 72 h, the relative luciferase activity of each transfectant was normalized to its GFP intensity and standardized to that of the vector control cells. In addition, HEK293T transfectants were treated with SP600125 or dimethyl sulfoxide for 48 h. The relative luciferase activity of each transfectant was normalized to its GFP intensity and standardized to that of the vector control cells (H and I).
Fig 4
Fig 4
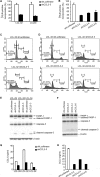
Knockdown of CCL3 induces cell apoptosis in EBV-transformed LCLs. LCLs were infected with lentiviruses carrying luciferase or CCL3 shRNAs. (A and B) After 6 days, 1 μCi [3H]thymidine was added to each well and incubation was continued for 18 h. The cells were harvested, and the incorporated [3H]thymidine was quantified. (C and D) After 7 days, the cells were harvested and stained with propidium iodide, followed by flow cytometric analysis. Representative data from LCL-32 are shown. (E and F) Expression of PARP-1 and caspase-3 was analyzed by Western blotting. β-Actin served as the internal control. (G and H) CCL3 protein concentrations in the culture supernatants of the LCLs were determined by ELISA to confirm the efficacy of the shRNAs.
Fig 5
Fig 5
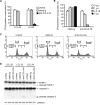
Blockade of CCL4 inhibits LCL proliferation and promotes apoptosis. LCLs were seeded at a density of 3 × 10⁵ cells/well in 24-well plates and treated with 2.5 μg/ml of CCL4 neutralization antibody or control rabbit Ig. Two days later, 1 μCi [3H]thymidine was added to each well. (A) After 18 h of incubation, the cells were harvested and the incorporated [3H]thymidine was quantified. (B) LCL-34 cells were treated with the amounts of CCL4 neutralization antibody or control rabbit Ig indicated. Two days later, 1 μCi [3H]thymidine was added to each well. After 18 h of incubation, the cells were harvested and the incorporated [3H]thymidine was quantified. (C and D) LCLs were seeded at a density of 3 × 10⁵ cells/well in 24-well plates and treated with 2.5 μg/ml CCL4 neutralization antibody or control rabbit Ig. After 72 h of incubation, apoptotic cells were detected by propidium iodide staining (C), and the expression of PARP-1, caspase-3, and GAPDH was visualized by Western blotting (D). untreat, untreated; Ab, antibody.
Fig 6
Fig 6
CCL3 levels are elevated in EBV-positive plasma from organ transplantation patients. Plasma samples were collected from patients posttransplantation. After detection of the EBV genome, the samples were divided into two groups, EBV negative (n = 18) and EBV positive (n = 12). CCL3 (A) and CCL4 (B) protein concentrations were quantified in the patients' plasma samples by ELISA.

Similar articles

Cited by

References

    1. Thorley-Lawson DA, Allday MJ. 2008. The curious case of the tumour virus: 50 years of Burkitt's lymphoma. Nat. Rev. Microbiol. 6:913–924 - PubMed
    1. Dawson CW, Port RJ, Young LS. 2012. The role of the EBV-encoded latent membrane proteins LMP1 and LMP2 in the pathogenesis of nasopharyngeal carcinoma (NPC). Semin. Cancer Biol. 22:144–153 - PubMed
    1. Martin D, Gutkind JS. 2008. Human tumor-associated viruses and new insights into the molecular mechanisms of cancer. Oncogene 27(Suppl 2):S31–S42 - PubMed
    1. Jabs WJ, Wagner HJ, Maurmann S, Hennig H, Kreft B. 2002. Inhibition of macrophage inflammatory protein-1α production by Epstein-Barr virus. Blood 99:1512–1516 - PubMed
    1. Gaudreault E, Fiola S, Olivier M, Gosselin J. 2007. Epstein-barr virus induces MCP-1 secretion by human monocytes via TLR2. J. Virol. 81:8016–8024 - PMC - PubMed

Publication types

MeSH terms

Substances

LinkOut - more resources