. 2013 May;15(5):511-22.
doi: 10.1593/neo.121784.

Epigenetic silencing of the proapoptotic gene BIM in anaplastic large cell lymphoma through an MeCP2/SIN3a deacetylating complex

Affiliations

Epigenetic silencing of the proapoptotic gene BIM in anaplastic large cell lymphoma through an MeCP2/SIN3a deacetylating complex

Rocco Piazza et al. Neoplasia. 2013 May.

Abstract

BIM is a proapoptotic member of the Bcl-2 family. Here, we investigated the epigenetic status of the BIM locus in NPM/ALK+ anaplastic large cell lymphoma (ALCL) cell lines and in lymph node biopsies from NPM/ALK+ ALCL patients. We show that BIM is epigenetically silenced in cell lines and lymph node specimens and that treatment with the deacetylase inhibitor trichostatin A restores the histone acetylation, strongly upregulates BIM expression, and induces cell death. BIM silencing occurs through recruitment of MeCP2 and the SIN3a/histone deacetylase 1/2 (HDAC1/2) corepressor complex. This event requires BIM CpG methylation/demethylation with 5-azacytidine that leads to detachment of the MeCP2 corepressor complex and reacetylation of the histone tails. Treatment with the ALK inhibitor PF2341066 or with an inducible shRNA targeting NPM/ALK does not restore BIM locus reacetylation; however, enforced expression of NPM/ALK in an NPM/ALK-negative cell line significantly increases the methylation at the BIM locus. This study demonstrates that BIM is epigenetically silenced in NPM/ALK-positive cells through recruitment of the SIN3a/HDAC1/2 corepressor complex and that NPM/ALK is dispensable to maintain BIM epigenetic silencing but is able to act as an inducer of BIM methylation.


Figures
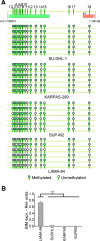
Figure 1
Figure 1
(A) Methylation pattern of BIM 5′UTR in SU-DHL-1, KARPAS299, and SUP-M2 and in the NPM/ALK-LAMA-84. The horizontal 5′ bar represents part of the BIM CpG Island; the vertical ticks represent individual CpG sites; the horizontal 3′ bar indicates the first coding exon. Filled circles represent methylated CpG sites; white circles refer to unmethylated ones. Horizontal bullet series represent sequential CpG sites; vertical series show different clones. (B) BIM mRNA levels in the LAMA-84, SU-DHL-1, KARPAS-299, and SUP-M2 cell lines. QPCR quantification of BIM relative to the housekeeping gene GUS is presented. The error bars represent the SD of three replicates.
Figure 2
Figure 2
(A) MSP analysis of BIM 5′UTR in six ALCL samples and in total lymphocytes from two healthy donors (controls 1 and 2). PCR products in lane U indicate the presence of unmethylated alleles, whereas PCR products in lane M indicate the presence of methylated alleles. (B) Immunoreactivity of neoplastic cells for anti-ALK p80 antibody (red) in lymph nodes of two NPM/ALK+ ALCL patients. (C) BIM methylation in lymph nodes from two primary ALCL patients (ALCL 1 and 2) and in total lymphocytes from two healthy donors (controls 1 and 2). Black arrows indicate highly methylated clones. (D) RT-MeDIP analysis of the BIM locus. In the upper panel, the results of the RT-MeDIP for SU-DHL-1 and LAMA-84 are shown. The histogram bars represent the relative enrichment for methylated DNA in five different regions of the BIM locus. In the lower panel, the schematic structure of the BIM genomic locus is shown: the gray boxes represent differently spliced exons; the striped gray box indicates the noncoding exon 1. The lower horizontal box represents the CpG island; the vertical black lines indicate the percentage of G and C bases in a five-base sliding window. The amplified regions are shown as thick black lines and labeled as regions R1 to R5. Asterisk indicates the first (5′) transcription start site.
Figure 3
Figure 3
(A) BIM methylation pattern in SU-DHL-1 and LAMA-84 untreated (-) or treated (+) with AZA. Horizontal circle series represent sequential CpG sites; vertical series represent different clones. (B) QPCR analysis of BIM expression in SU-DHL-1 and LAMA-84 cell lines after treatment with 1 µM AZA. Results are shown as fold increase relative to the untreated samples. Error bars represent the SD of three replicates. The LAMA-84 cell line, in which BIM locus is largely unmethylated, is used as a control. (C) Western blot analysis of BIM expression in SU-DHL-1 and LAMA-84 cell lines untreated (-) or treated (+) with 1 µM AZA for 5 days. All the three major BIM isoforms are shown. (D) TUNEL assay of SU-DHL-1 and LAMA-84 cells untreated or treated with 1 µM AZA. The graph shows the percentage of apoptotic cells as an average of three independent experiments.
Figure 4
Figure 4
(A) α-Acetylated H3 ChIP analysis on SU-DHL-1, KARPAS-299, SUP-M2, and LAMA-84 cell lines. Immunoprecipitates (Ac-H3) were subjected to PCR with primer pairs specific for BIM and for GAPDH, as a positive control. PCRs were performed also using total chromatin input (INPUT) as template. (B) Densitometric analysis of acetylated H3 enrichment of BIM locus in the same cell lines (bands shown in panel). (C) α-Acetylated H3 ChIP analysis before and after treatment with 500 nM TSA. (D) BIM mRNA levels assessed by QPCR before and after treatment with 500 nM TSA. (E) TUNEL assay of SU-DHL-1 and LAMA-84 cells untreated or treated with 500 nM TSA for 3 days. The graph shows the percentage of apoptotic cells as an average of three independent experiments.
Figure 5
Figure 5
(A) BIM mRNA level after the induction with doxycycline. (B) Expression level of Bim 12 hours after the induction, as assessed by Western blot. (C) Percentage of apoptosis after 12 hours of induction in KARPAS-299 TR1 and in KARPAS-299 Bim, as assessed by TUNEL assay. (D and E) Identification of the repressor complex associated with the epigenetic silencing of BIM locus. (D) ChIP analyses using α-HDAC 1, 2, and 3 antibodies were performed in SU-DHL-1 to identify the HDACs involved in BIM silencing. The immunoprecipitates were analyzed using QPCR. The error bars represent the SD of three replicates. (E) Characterization of the repressor complex involved in BIM silencing with ChIP experiments using α-MBD3, MeCP2, Kaiso, and NCoR antibodies. The immunoprecipitates were analyzed using QPCR. (F) α-MeCP2 ChIP analysis was performed in untreated cells (-) and in cells treated with 1 µM AZA (+), and immunoprecipitates were then analyzed using QPCR. (G) The effect of a demethylating agent on the acetylation status of histone H3 tails at BIM locus was investigated with α-acetylated H3 ChIP analysis in SU-DHL-1 in the absence (-) and in the presence (+) of 1 µM AZA. Immunoprecipitates (Ac-H3) were subjected to PCR with primer pairs specific for BIM and for GAPDH, as a positive control. PCRs were performed also using total chromatin input (INPUT) as template.
Figure 6
Figure 6
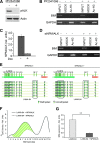
(A) Western blot against phospho-ALK in the presence and absence of the ALK tyrosine kinase inhibitor PF2341066. Results are normalized against β-actin. (B) α-Acetylated H3 ChIP analysis of BIM locus before and after treatment with the ALK tyrosine kinase inhibitor PF2341066. (C) QPCR analysis of NPM/ALK mRNA expression before and after treatment with doxycycline in SU-DHL-1 cells carrying a doxycycline-inducible siRNA against NPM/ALK. (D) α-Acetylated H3 ChIP analysis of BIM locus before and after treatment with doxycycline. (E) Methylation pattern of BIM 5′UTR in LAMA-84 cells expressing (+) or not expressing (-) the NPM/ALK fusion protein. Filled circles represent methylated CpG sites; white circles represent unmethylated ones. Horizontal circle series represent sequential CpG sites; vertical series represent different clones. Black rounded rectangles indicate regions with a regular pattern of highly methylated CpG sites. (F) Polynomial regression of methylated CpG density pattern in LAMA-84 cells expressing (solid line) or not expressing (dashed line) NPM/ALK. The striped area highlights the region with a different methylation density between the two samples. (G) QPCR analysis of BIM expression in LAMA-84 cells transfected with NPM/ALK (+NPM/ALK) or an empty vector (-NPM/ALK). Error bars represent the SD of three replicates.
Figure 7
Figure 7
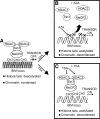
(A) Outline of the proposed model for the epigenetic silencing of BIM: NPM/ALK triggers BIM CpG methylation through a yet unknown pathway. Then, the methyl-CpG-binding protein MeCP2 binds to the 5-methylcytosines and recruits HDAC1, HDAC2, and the corepressor Sin3a. The activity of this complex leads to histone tail deacetylation, chromatin condensation, and BIM transcriptional repression. (B) Treatment with the demethylating agent AZA leads to BIM CpG island demethylation, detachment of MeCP2, disruption of the deacetylating complex, and reactivation of BIM transcription. (C) Treatment with the HDACi TSA causes direct inhibition of HDAC1/2 enzymatic activity, chromatin decondensation, and reactivation of BIM transcription.

Similar articles

Cited by

References

    1. Fletcher JI, Huang DC. Controlling the cell death mediators Bax and Bak: puzzles and conundrums. Cell Cycle. 2008;7:39–44. E-pub 2007 Oct 2016. - PubMed
    1. Bouillet P, Metcalf D, Huang DC, Tarlinton DM, Kay TW, Kontgen F, Adams JM, Strasser A. Proapoptotic Bcl-2 relative Bim required for certain apoptotic responses, leukocyte homeostasis, and to preclude autoimmunity. Science. 1999;286:1735–1738. - PubMed
    1. Egle A, Harris AW, Bouillet P, Cory S. Bim is a suppressor of Myc-induced mouse B cell leukemia. Proc Natl Acad Sci USA. 2004;101:6164–6169. E-pub 2004 Apr 6112. - PMC - PubMed
    1. Tagawa H, Karnan S, Suzuki R, Matsuo K, Zhang X, Ota A, Morishima Y, Nakamura S, Seto M. Genome-wide array-based CGH for mantle cell lymphoma: identification of homozygous deletions of the proapoptotic gene BIM. Oncogene. 2005;24:1348–1358. - PubMed
    1. Gama-Sosa MA, Slagel VA, Trewyn RW, Oxenhandler R, Kuo KC, Gehrke CW, Ehrlich M. The 5-methylcytosine content of DNA from human tumors. Nucleic Acids Res. 1983;11:6883–6894. - PMC - PubMed

Publication types

MeSH terms