Gene expression changes in aging retinal microglia: relationship to microglial support functions and regulation of activation
- PMID: 23608111
- PMCID: PMC3706521
- DOI: 10.1016/j.neurobiolaging.2013.03.022
Gene expression changes in aging retinal microglia: relationship to microglial support functions and regulation of activation
Abstract
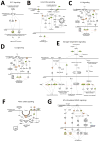
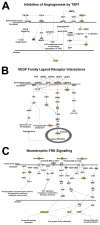
Microglia, the resident immune cells of the central nervous system (CNS), are thought to contribute to the pathogenesis of age-related neurodegenerative disorders. It has been hypothesized that microglia undergo age-related changes in gene expression patterns that give rise to pathogenic phenotypes. We compared the gene expression profiles in microglia isolated ex vivo from the retinas of mice ranging from early adulthood to late senescence. We discovered that microglial gene expression demonstrated progressive change with increasing age, and involved genes that regulate microglial supportive functions and immune activation. Molecular pathways involving immune function and regulation, angiogenesis, and neurotrophin signaling demonstrated age-related change. In particular, expression levels of complement genes, C3 and CFB, previously associated with age-related macular degeneration (AMD), increased with aging, suggesting that senescent microglia may contribute to complement dysregulation during disease pathogenesis. Taken together, senescent microglia demonstrate age-related gene expression changes capable of altering their constitutive support functions and regulation of their activation status in ways relating to neuroinflammation and neurodegeneration in the CNS.
Keywords: Activation; Aging; Angiogenesis; Complement; Gene expression; Microarray; Microglia; Neurotrophic factors; Retina; Senescence.
Published by Elsevier Inc.
Conflict of interest statement
All authors indicate that they do not have conflicts of interest to disclose.
Figures


Similar articles
-
Aging Changes in Retinal Microglia and their Relevance to Age-related Retinal Disease.Adv Exp Med Biol. 2016;854:73-8. doi: 10.1007/978-3-319-17121-0_11. Adv Exp Med Biol. 2016. PMID: 26427396 Free PMC article. Review.
-
A2E accumulation influences retinal microglial activation and complement regulation.Neurobiol Aging. 2013 Mar;34(3):943-60. doi: 10.1016/j.neurobiolaging.2012.06.010. Epub 2012 Jul 20. Neurobiol Aging. 2013. PMID: 22819137 Free PMC article.
-
Age-related alterations in the dynamic behavior of microglia.Aging Cell. 2011 Apr;10(2):263-76. doi: 10.1111/j.1474-9726.2010.00660.x. Epub 2010 Dec 29. Aging Cell. 2011. PMID: 21108733 Free PMC article.
-
Retinal Macrophages Synthesize C3 and Activate Complement in AMD and in Models of Focal Retinal Degeneration.Invest Ophthalmol Vis Sci. 2017 Jun 1;58(7):2977-2990. doi: 10.1167/iovs.17-21672. Invest Ophthalmol Vis Sci. 2017. PMID: 28605809
-
Microglia Contribution to the Regulation of the Retinal and Choroidal Vasculature in Age-Related Macular Degeneration.Cells. 2020 May 14;9(5):1217. doi: 10.3390/cells9051217. Cells. 2020. PMID: 32423062 Free PMC article. Review.
Cited by
-
Age-Related Macular Degeneration: A Disease of Cellular Senescence and Dysregulated Immune Homeostasis.Clin Interv Aging. 2024 May 23;19:939-951. doi: 10.2147/CIA.S463297. eCollection 2024. Clin Interv Aging. 2024. PMID: 38807637 Free PMC article. Review.
-
Complement regulation in the eye: implications for age-related macular degeneration.J Clin Invest. 2024 May 1;134(9):e178296. doi: 10.1172/JCI178296. J Clin Invest. 2024. PMID: 38690727 Free PMC article. Review.
-
In a novel autoimmune and high-pressure glaucoma model a complex immune response is induced.Front Immunol. 2024 Mar 7;15:1296178. doi: 10.3389/fimmu.2024.1296178. eCollection 2024. Front Immunol. 2024. PMID: 38515755 Free PMC article.
-
The Role of Complement Dysregulation in Glaucoma.Int J Mol Sci. 2024 Feb 15;25(4):2307. doi: 10.3390/ijms25042307. Int J Mol Sci. 2024. PMID: 38396986 Free PMC article. Review.
-
Age-Related RPE changes in Wildtype C57BL/6J Mice between 2 and 32 Months.bioRxiv [Preprint]. 2024 Feb 1:2024.01.30.574142. doi: 10.1101/2024.01.30.574142. bioRxiv. 2024. PMID: 38352604 Free PMC article. Preprint.
References
-
- Ajami B, Bennett JL, Krieger C, Tetzlaff W, Rossi FM. Local self-renewal can sustain CNS microglia maintenance and function throughout adult life. Nat Neurosci. 2007;10:1538–1543. - PubMed
-
- Bakalash S, Pham M, Koronyo Y, Salumbides BC, Kramerov A, Seidenberg H, Berel D, Black KL, Koronyo-Hamaoui M. Egr1 expression is induced following glatiramer acetate immunotherapy in rodent models of glaucoma and Alzheimer’s disease. Invest Ophthalmol Vis Sci. 2011;52:9033–9046. - PubMed
Publication types
MeSH terms
Substances
Grants and funding
LinkOut - more resources
Full Text Sources
Other Literature Sources
Medical
Miscellaneous

