Persistent LCMV infection is controlled by blockade of type I interferon signaling
- PMID: 23580529
- PMCID: PMC3640797
- DOI: 10.1126/science.1235214
Persistent LCMV infection is controlled by blockade of type I interferon signaling
Abstract
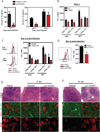
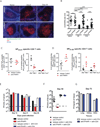
During persistent viral infections, chronic immune activation, negative immune regulator expression, an elevated interferon signature, and lymphoid tissue destruction correlate with disease progression. We demonstrated that blockade of type I interferon (IFN-I) signaling using an IFN-I receptor neutralizing antibody reduced immune system activation, decreased expression of negative immune regulatory molecules, and restored lymphoid architecture in mice persistently infected with lymphocytic choriomeningitis virus. IFN-I blockade before and after establishment of persistent virus infection resulted in enhanced virus clearance and was CD4 T cell-dependent. Hence, we demonstrate a direct causal link between IFN-I signaling, immune activation, negative immune regulator expression, lymphoid tissue disorganization, and virus persistence. Our results suggest that therapies targeting IFN-I may help control persistent virus infections.
Figures


Comment in
-
Immunology. An interferon paradox.Science. 2013 Apr 12;340(6129):155-6. doi: 10.1126/science.1237568. Science. 2013. PMID: 23580520 Free PMC article.
Similar articles
-
Blockade of chronic type I interferon signaling to control persistent LCMV infection.Science. 2013 Apr 12;340(6129):202-7. doi: 10.1126/science.1235208. Science. 2013. PMID: 23580528 Free PMC article.
-
Negative regulation of type I IFN expression by OASL1 permits chronic viral infection and CD8⁺ T-cell exhaustion.PLoS Pathog. 2013;9(7):e1003478. doi: 10.1371/journal.ppat.1003478. Epub 2013 Jul 18. PLoS Pathog. 2013. PMID: 23874199 Free PMC article.
-
Interfering with type I interferon: a novel approach to purge persistent viral infection.Cell Cycle. 2013 Sep 15;12(18):2919-20. doi: 10.4161/cc.26175. Epub 2013 Aug 23. Cell Cycle. 2013. PMID: 23974094 Free PMC article. No abstract available.
-
Confounding roles for type I interferons during bacterial and viral pathogenesis.Int Immunol. 2013 Dec;25(12):663-9. doi: 10.1093/intimm/dxt050. Epub 2013 Oct 24. Int Immunol. 2013. PMID: 24158954 Free PMC article. Review.
-
Viral persistence: parameters, mechanisms and future predictions.Virology. 2006 Jan 5;344(1):111-8. doi: 10.1016/j.virol.2005.09.028. Virology. 2006. PMID: 16364742 Review.
Cited by
-
Long-Term Liver Expression of an Apolipoprotein A-I Mimetic Peptide Attenuates Interferon-Alpha-Induced Inflammation and Promotes Antiviral Activity.Front Immunol. 2021 Feb 23;11:620283. doi: 10.3389/fimmu.2020.620283. eCollection 2020. Front Immunol. 2021. PMID: 33708194 Free PMC article.
-
The myeloid cell type I IFN system promotes antitumor immunity over pro-tumoral inflammation in cancer T-cell therapy.Clin Transl Immunology. 2021 Apr 29;10(4):e1276. doi: 10.1002/cti2.1276. eCollection 2021. Clin Transl Immunology. 2021. PMID: 33968406 Free PMC article.
-
Type I Interferons Induce T Regulatory 1 Responses and Restrict Humoral Immunity during Experimental Malaria.PLoS Pathog. 2016 Oct 12;12(10):e1005945. doi: 10.1371/journal.ppat.1005945. eCollection 2016 Oct. PLoS Pathog. 2016. PMID: 27732671 Free PMC article.
-
The Role of Type I IFNs in Influenza: Antiviral Superheroes or Immunopathogenic Villains?J Innate Immun. 2020;12(6):437-447. doi: 10.1159/000508379. Epub 2020 Jun 19. J Innate Immun. 2020. PMID: 32564033 Free PMC article. Review.
-
Clash of the Cytokine Titans: counter-regulation of interleukin-1 and type I interferon-mediated inflammatory responses.Cell Mol Immunol. 2017 Jan;14(1):22-35. doi: 10.1038/cmi.2016.25. Epub 2016 Jun 6. Cell Mol Immunol. 2017. PMID: 27264686 Free PMC article. Review.
References
Publication types
MeSH terms
Substances
Grants and funding
- T32 AI007354/AI/NIAID NIH HHS/United States
- AI077719/AI/NIAID NIH HHS/United States
- R37 CA043059/CA/NCI NIH HHS/United States
- T32 HL007195/HL/NHLBI NIH HHS/United States
- AI007354/AI/NIAID NIH HHS/United States
- AI09484/AI/NIAID NIH HHS/United States
- CA43059/CA/NCI NIH HHS/United States
- HL007195/HL/NHLBI NIH HHS/United States
- R01 AI009484/AI/NIAID NIH HHS/United States
- U54 AI057160/AI/NIAID NIH HHS/United States
- T32 NS041219/NS/NINDS NIH HHS/United States
- R01 AI077719/AI/NIAID NIH HHS/United States
- AI047140/AI/NIAID NIH HHS/United States
- NS041219/NS/NINDS NIH HHS/United States
- U54AI057160/AI/NIAID NIH HHS/United States
- R01 AI047140/AI/NIAID NIH HHS/United States
- R56 AI077719/AI/NIAID NIH HHS/United States
- R01 CA043059/CA/NCI NIH HHS/United States
LinkOut - more resources
Full Text Sources
Other Literature Sources
Research Materials

