

Genome-wide reprogramming of the chromatin landscape underlies endocrine therapy resistance in breast cancer
- PMID: 23576735
- PMCID: PMC3631697
- DOI: 10.1073/pnas.1219992110
Genome-wide reprogramming of the chromatin landscape underlies endocrine therapy resistance in breast cancer
Abstract
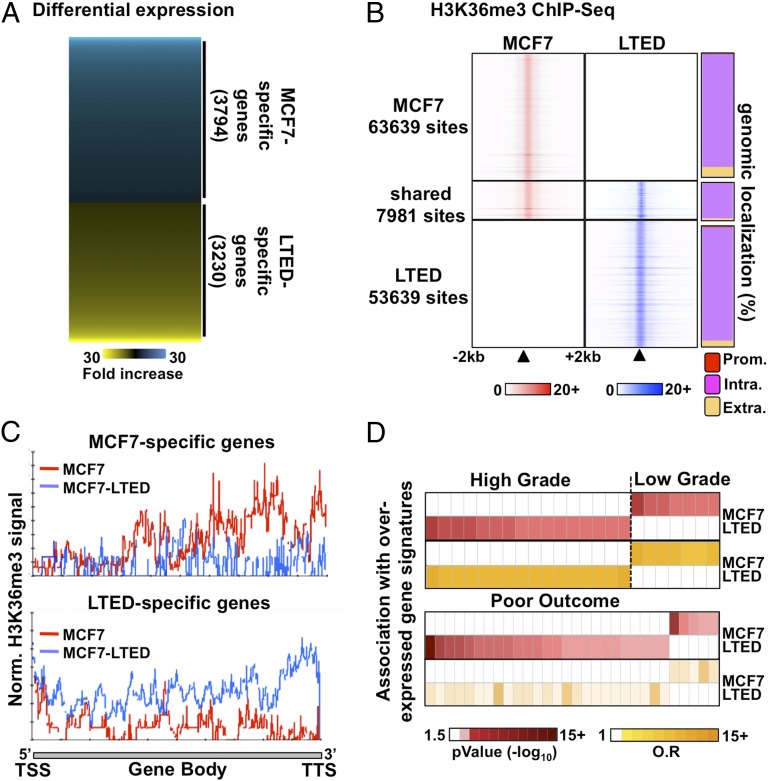
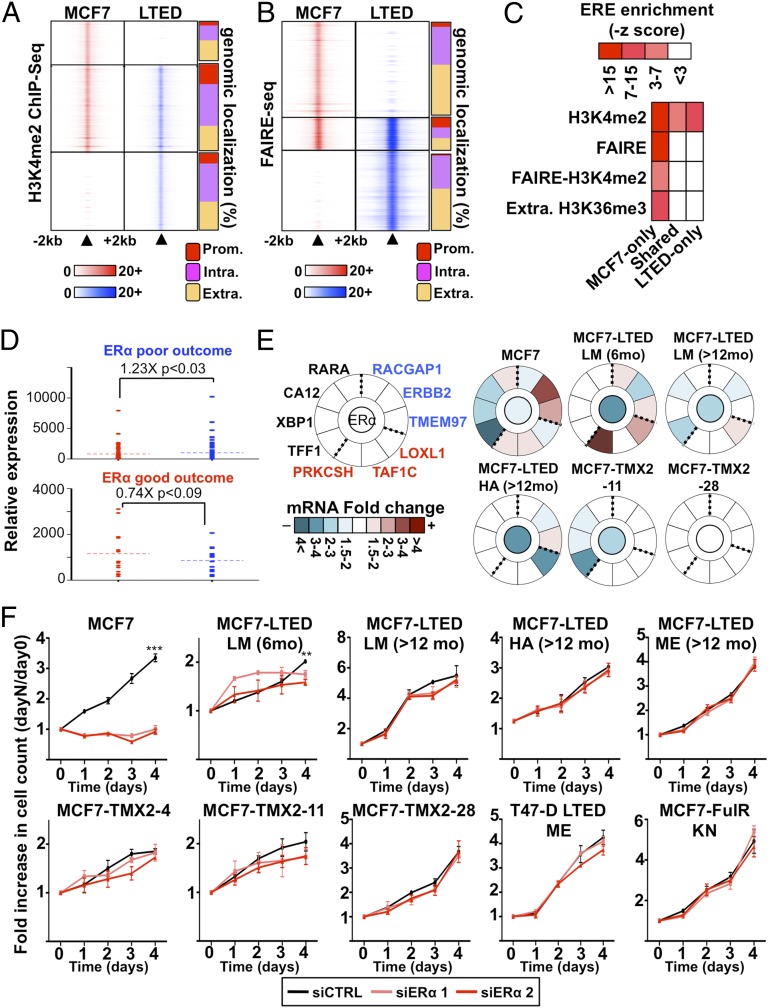
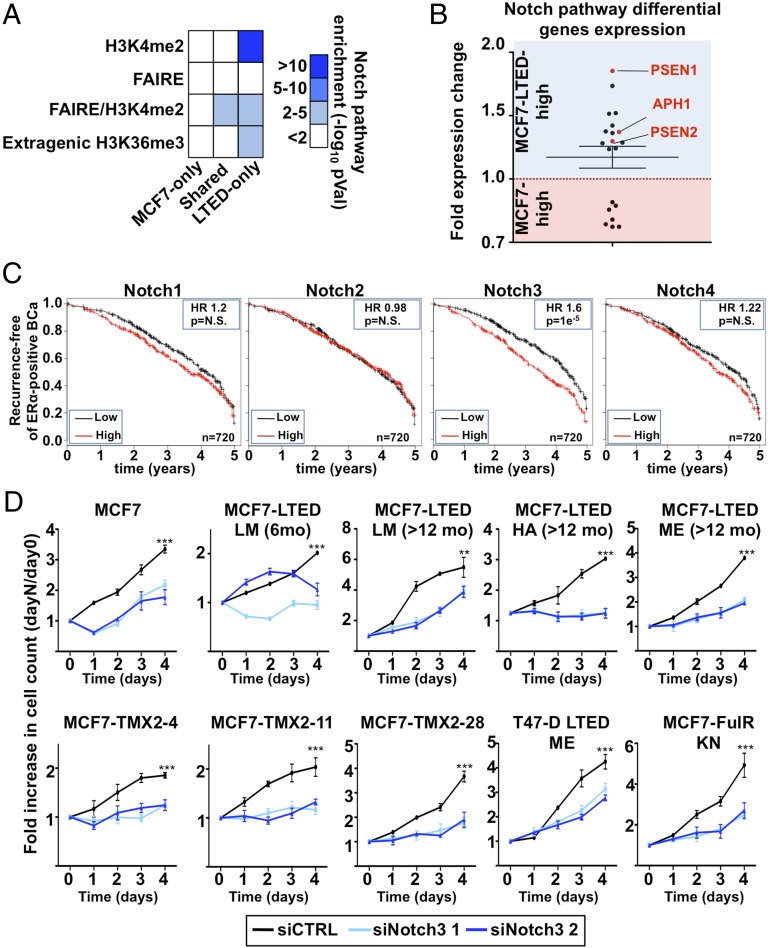
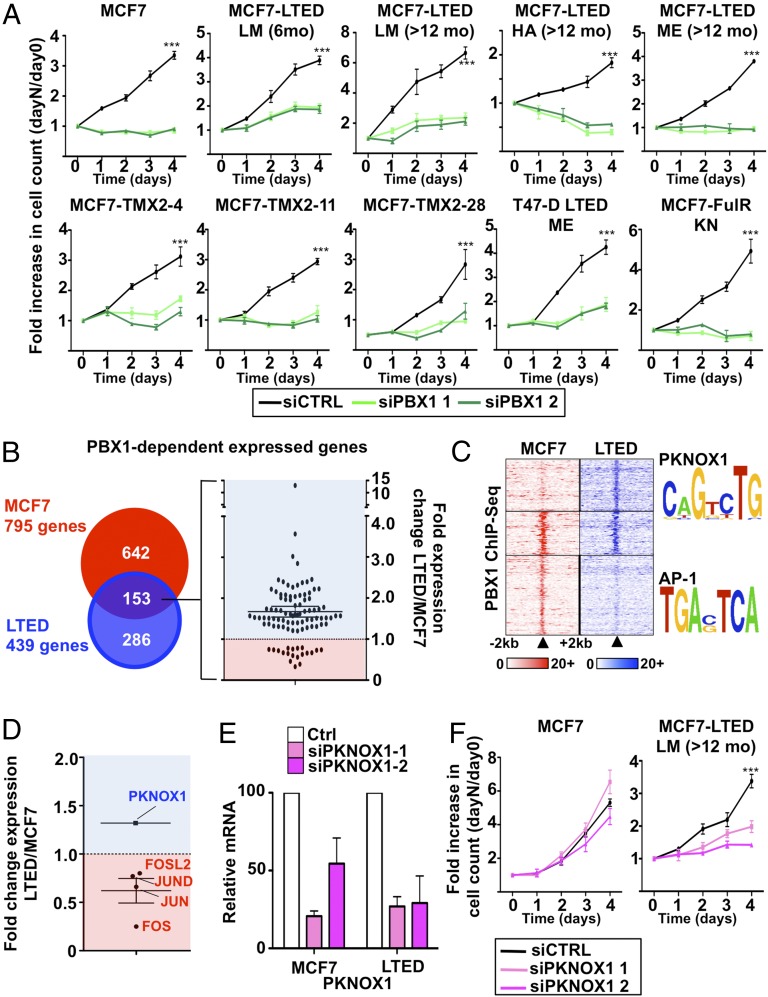
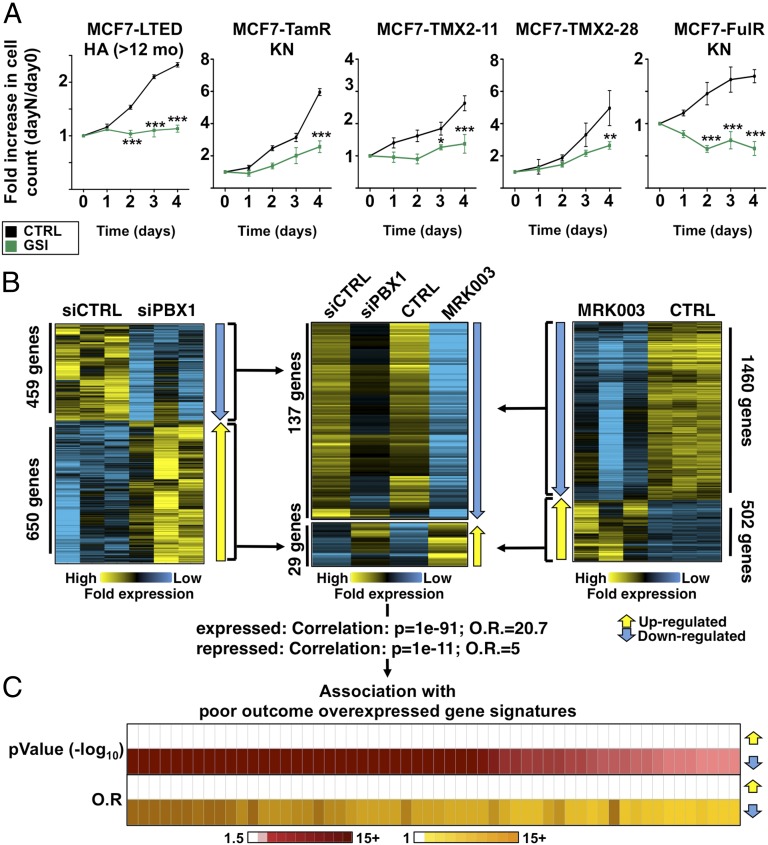
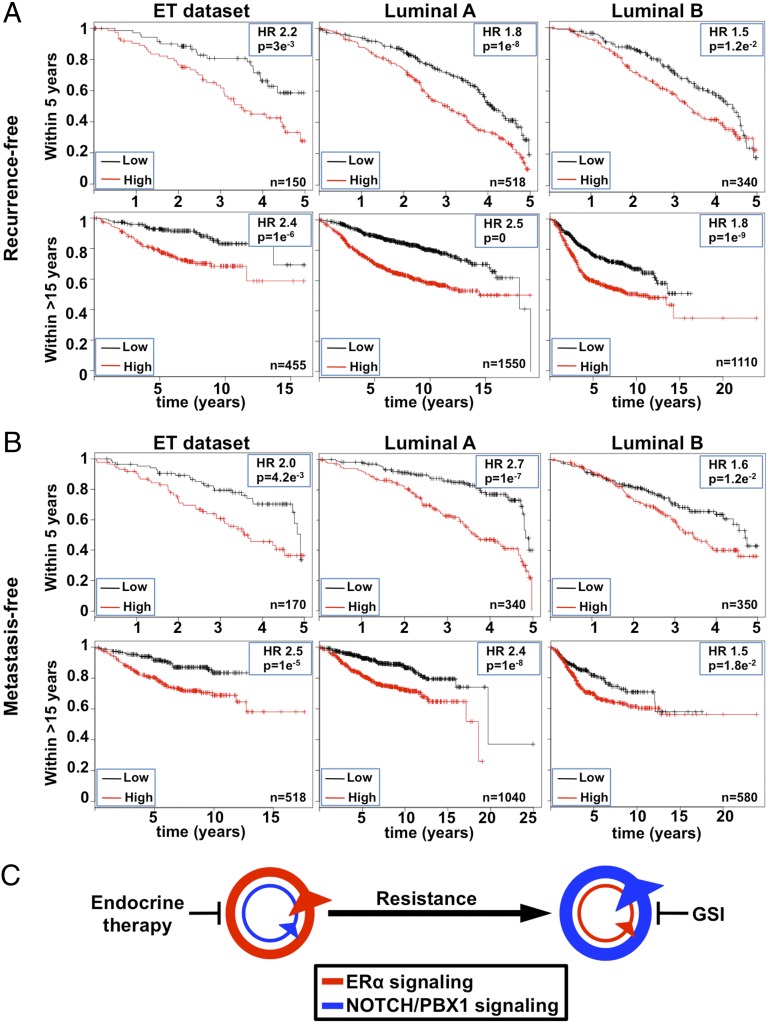
The estrogen receptor (ER)α drives growth in two-thirds of all breast cancers. Several targeted therapies, collectively termed endocrine therapy, impinge on estrogen-induced ERα activation to block tumor growth. However, half of ERα-positive breast cancers are tolerant or acquire resistance to endocrine therapy. We demonstrate that genome-wide reprogramming of the chromatin landscape, defined by epigenomic maps for regulatory elements or transcriptional activation and chromatin openness, underlies resistance to endocrine therapy. This annotation reveals endocrine therapy-response specific regulatory networks where NOTCH pathway is overactivated in resistant breast cancer cells, whereas classical ERα signaling is epigenetically disengaged. Blocking NOTCH signaling abrogates growth of resistant breast cancer cells. Its activation state in primary breast tumors is a prognostic factor of resistance in endocrine treated patients. Overall, our work demonstrates that chromatin landscape reprogramming underlies changes in regulatory networks driving endocrine therapy resistance in breast cancer.
Conflict of interest statement
Conflict of interest statement: L.M. and M.L. hold a patent on the use of PBX1 and the NOTCH/PBX1-dependent gene signature presented in this paper for prognostic purposes to discriminate endocrine therapy-responsive from nonresponsive ERα-positive breast cancer patients.
Figures
Similar articles
-
Chromatin landscape and endocrine response in breast cancer.Epigenomics. 2012 Dec;4(6):675-83. doi: 10.2217/epi.12.64. Epigenomics. 2012. PMID: 23244312 Review.
-
DMXL2 drives epithelial to mesenchymal transition in hormonal therapy resistant breast cancer through Notch hyper-activation.Oncotarget. 2015 Sep 8;6(26):22467-79. doi: 10.18632/oncotarget.4164. Oncotarget. 2015. PMID: 26093085 Free PMC article.
-
KLF17 attenuates estrogen receptor α-mediated signaling by impeding ERα function on chromatin and determines response to endocrine therapy.Biochim Biophys Acta. 2016 Jul;1859(7):883-95. doi: 10.1016/j.bbagrm.2016.04.009. Epub 2016 Apr 21. Biochim Biophys Acta. 2016. PMID: 27107895
-
Differential epigenetic reprogramming in response to specific endocrine therapies promotes cholesterol biosynthesis and cellular invasion.Nat Commun. 2015 Nov 27;6:10044. doi: 10.1038/ncomms10044. Nat Commun. 2015. PMID: 26610607 Free PMC article.
-
Mechanisms of endocrine resistance and novel therapeutic strategies in breast cancer.Endocr Relat Cancer. 2005 Dec;12(4):721-47. doi: 10.1677/erc.1.00857. Endocr Relat Cancer. 2005. PMID: 16322319 Review.
Cited by
-
In vitro breast cancer models for studying mechanisms of resistance to endocrine therapy.Explor Target Antitumor Ther. 2022;3(3):297-320. doi: 10.37349/etat.2022.00084. Epub 2022 Jun 1. Explor Target Antitumor Ther. 2022. PMID: 36045910 Free PMC article. Review.
-
Targeting Metabolic Adaptations in the Breast Cancer-Liver Metastatic Niche Using Dietary Approaches to Improve Endocrine Therapy Efficacy.Mol Cancer Res. 2022 Jun 3;20(6):923-937. doi: 10.1158/1541-7786.MCR-21-0781. Mol Cancer Res. 2022. PMID: 35259269 Free PMC article.
-
Estrogen signaling crosstalk: Implications for endocrine resistance in ovarian cancer.J Steroid Biochem Mol Biol. 2014 Sep;143:160-73. doi: 10.1016/j.jsbmb.2014.02.010. Epub 2014 Feb 22. J Steroid Biochem Mol Biol. 2014. PMID: 24565562 Free PMC article. Review.
-
PBX1: a key character of the hallmarks of cancer.J Mol Med (Berl). 2021 Dec;99(12):1667-1680. doi: 10.1007/s00109-021-02139-2. Epub 2021 Sep 16. J Mol Med (Berl). 2021. PMID: 34529123 Review.
-
A Role for Notch Signalling in Breast Cancer and Endocrine Resistance.Stem Cells Int. 2016;2016:2498764. doi: 10.1155/2016/2498764. Epub 2016 Jan 10. Stem Cells Int. 2016. PMID: 26880941 Free PMC article. Review.
References
Publication types
MeSH terms
Substances
Associated data
- Actions
- Actions
Grants and funding
LinkOut - more resources
Full Text Sources
Other Literature Sources
Medical
Molecular Biology Databases
