Clinical Trial
. 2013 May;139(1):19-29.
doi: 10.1111/imm.12045.

TGR5 signalling inhibits the production of pro-inflammatory cytokines by in vitro differentiated inflammatory and intestinal macrophages in Crohn's disease

Affiliations
Clinical Trial

TGR5 signalling inhibits the production of pro-inflammatory cytokines by in vitro differentiated inflammatory and intestinal macrophages in Crohn's disease

Kazuaki Yoneno et al. Immunology. 2013 May.

Abstract

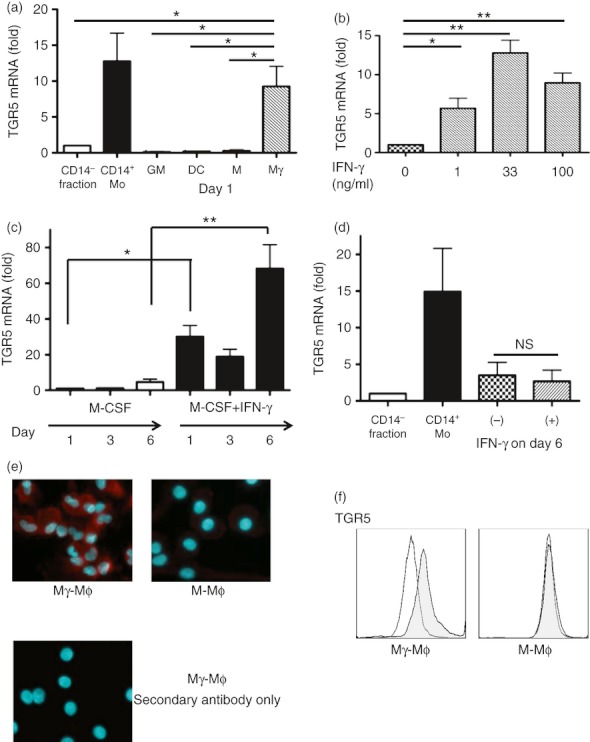
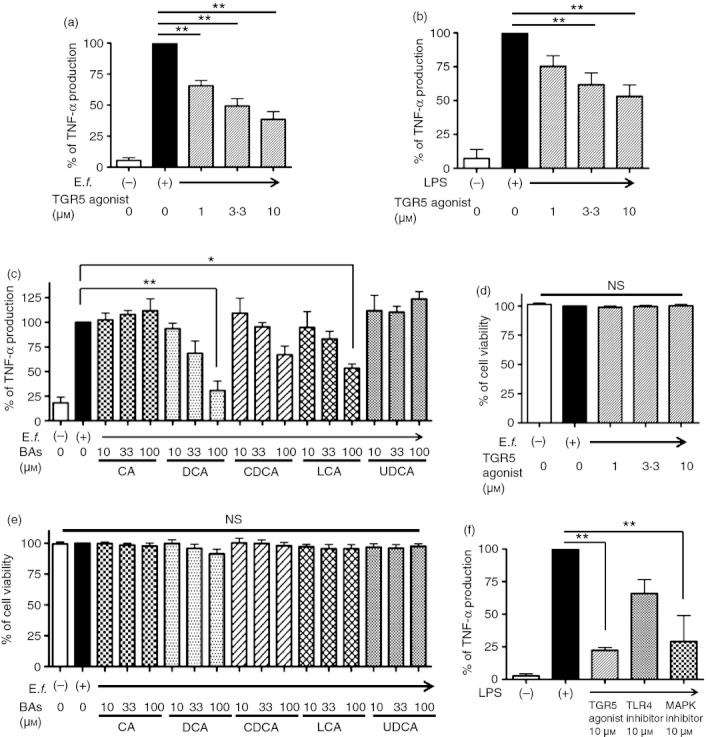
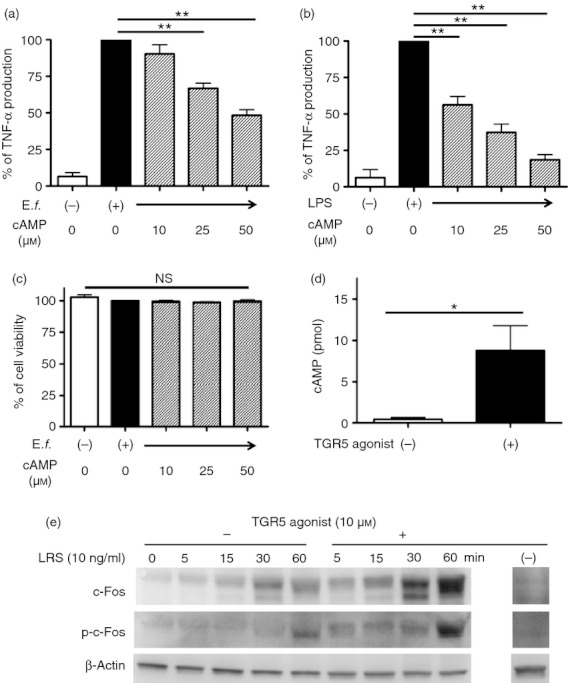
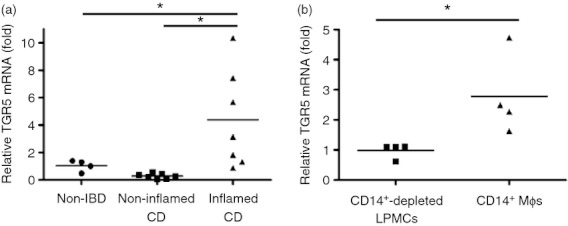
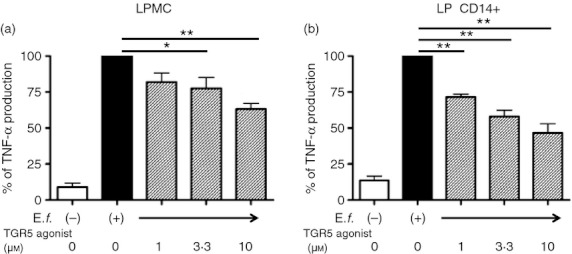
Bile acids (BAs) play important roles not only in lipid metabolism, but also in signal transduction. TGR5, a transmembrane receptor of BAs, is an immunomodulative factor, but its detailed mechanism remains unclear. Here, we aimed to delineate how BAs operate in immunological responses via the TGR5 pathway in human mononuclear cell lineages. We examined TGR5 expression in human peripheral blood monocytes, several types of in vitro differentiated macrophages (Mϕs) and dendritic cells. Mϕs differentiated with macrophage colony-stimulating factor and interferon-γ (Mγ-Mϕs), which are similar to the human intestinal lamina propria CD14(+) Mϕs that contribute to Crohn's disease (CD) pathogenesis by production of pro-inflammatory cytokines, highly expressed TGR5 compared with any other type of differentiated Mϕ and dendritic cells. We also showed that a TGR5 agonist and two types of BAs, deoxycholic acid and lithocholic acid, could inhibit tumour necrosis factor-α production in Mγ-Mϕs stimulated by commensal bacterial antigen or lipopolysaccharide. This inhibitory effect was mediated by the TGR5-cAMP pathway to induce phosphorylation of c-Fos that regulated nuclear factor-κB p65 activation. Next, we analysed TGR5 levels in lamina propria mononuclear cells (LPMCs) obtained from the intestinal mucosa of patients with CD. Compared with non-inflammatory bowel disease, inflamed CD LPMCs contained more TGR5 transcripts. Among LPMCs, isolated CD14(+) intestinal Mϕs from patients with CD expressed TGR5. In isolated intestinal CD14(+) Mϕs, a TGR5 agonist could inhibit tumour necrosis factor-α production. These results indicate that TGR5 signalling may have the potential to modulate immune responses in inflammatory bowel disease.


Figures

Figure 1
Figure 1
Chemical structure of the 3-(2-chlorophenyl)-N-(4-chlorophenyl)-N, 5-dimethylisoxazole-4-carboxamide as the TGR5 agonist we used in this study. This compound precursor was discovered by a high-throughput screening of the GlaxoSmithKline Pharmaceuticals (Collegeville, PA) compound library using a luciferase assay, the production of which was caused by cAMP. In the process of exploring substitution derivative analysis, this TGR5 agonist was found out as a high affinity for TGR5 (pEC50 = 6·8) of U2-OS cells.
Figure 2
Figure 2
Macrophages differentiated with macrophage colony-stimulating factor and interferon-γ (Mγ-Mϕs) differentiated from peripheral blood CD14+ monocytes maintain TGR5 expression. (a) The mRNA level of TGR5 in the CD14 fraction of peripheral blood mononuclear cells (PBMCs), CD14+ monocytes and Mϕs differentiated with macrophage colony-stimulating factor alone (M-Mϕs), dendritic cells (DCs), Mϕs differentiated with granulocyte–macrophage colony-stimulating factor and interferon-γ (GM-Mϕs) and Mγ-Mϕs on day 1 was measured by real-time quantitative PCR. The mRNA level of TGR5 was normalized to that of β-actin, and is shown as the fold change based on the mRNA levels in the CD14 fraction. Results are shown as the means ± SEM from three independent experiments. Statistical analysis was performed by Kruskal–Wallis one-way analysis of variance (anova)and the Bonferroni post-hoc test for multiple comparisons. *P < 0·05, Mo: monocytes, GM: GM-Mϕs, DC: dendritic cells, M: M-Mϕs, Mγ: Mγ-Mϕs. (b) The mRNA level of TGR5 in differentiated Mγ-Mϕs for each interferon-γ concentration (0, 1, 33 and 100 ng/ml) on day 1. The mRNA level of TGR5 was normalized to that of β-actin, and is shown as the fold change based on the mRNA levels in Mϕs without interferon-γ stimulation. Results are shown as the means ± SEM from five independent experiments. Statistical analysis was performed by Kruskal–Wallis one-way anova and the Bonferroni post-hoc test for multiple comparisons. *P < 0·05, **P < 0·01. (c) The mRNA level of TGR5 in differentiated M-Mϕs and Mγ-Mϕs on day 1, 3 and 6. The mRNA level of TGR5 was normalized to that of β-actin, and is shown as the fold change based on the mRNA level in M-Mϕs on day 1. Results are shown as the means ± SEM from five independent experiments. Statistical analysis was performed by Kruskal–Wallis one-way anova and the Bonferroni post-hoc test for multiple comparisons. *P < 0·05, **P < 0·01. (d) The mRNA level of TGR5 in the CD14 fraction of PBMCs, CD14+ monocytes (Mo) and differentiated M-Mϕs on day 7, which were stimulated with or without interferon-γ on day 6. The mRNA level of TGR5 was normalized to that of β-actin, and is shown as the fold change based on the mRNA levels in CD14 fraction of PBMCs. Results are shown as the means ± SEM from four independent experiments. Statistical analysis was performed by Kruskal–Wallis one-way anova and the Bonferroni post-hoc test for multiple comparisons. (e) Fluorescence imaging of M-Mϕs and Mγ-Mϕs on day 6 of differentiation are shown. Mγ-Mϕs stained with the secondary antibody only was shown as the negative control. Red: TGR5, Blue: nuclei. (f) Flow cytometry analysis for TGR5 expression of differentiated M-Mϕs and Mγ-Mϕs (on day 6). The shaded histogram shows the profiles of the TGR5 antibody staining and the open histogram shows staining with the isotype control.
Figure 3
Figure 3
A TGR5 agonist and bile acids (BAs) suppress tumour necrosis factor-α (TNF-α) production from macrophages differentiated with macrophage colony-stimulating factor (M-CSF) and interferon-γ (IFNγ) (Mγ-Mϕs) stimulated by Enterococcus faecalis or lipopolysaccharide (LPS). (a) The Mγ-Mϕs were differentiated from CD14+ monocytes with M-CSF and IFNγ; 50 and 100 ng/ml, respectively). After 6 days in culture, TNF-α levels in culture supernatants were analysed after 24 hr of stimulation with E. faecalis (multiplicity of infection = 100) with or without the TGR5 agonist (1, 3·3 and 10 μm). Results are shown as the means ± SEM from seven independent experiments as relative percentages of the TNF-α levels in Mγ-Mϕs stimulated with E. faecalis only. Statistical analysis was performed by Kruskal–Wallis one-way analysis of variance (anova) and the Bonferroni post-hoc test for multiple comparisons. **P < 0·01. (b) Similar TNF-α analysis to that in (a), stimulated with LPS (100 ng/ml) with or without the TGR5 agonist. Results are shown as the means ± SEM from five independent experiments as relative percentages of the TNF-α levels in Mγ-Mϕs stimulated with LPS only. Statistical analysis was performed by Kruskal–Wallis one-way anova and the Bonferroni post-hoc test for multiple comparisons. **P < 0·01. (c) Several BAs inhibited TNF-α production, which was promoted by E. faecalis (multiplicity of infection = 100) after 24 hr of stimulation, from Mγ-Mϕs on day 6. Results are shown as the means ± SEM from three independent experiments as relative percentages of the TNF-α levels in Mγ-Mϕs stimulated with E. faecalis only. Statistical analysis was performed by Kruskal–Wallis one-way anova and the Bonferroni post-hoc test for multiple comparisons. *P < 0·05, **P < 0·01. CA, cholic acid; DCA, deoxycholic acid; CDCA, chenodeoxycholic acid; LCA, lithocholic acid; UDCA, ursodeoxycholic acid; (d, e) Cell viability of peripheral blood mononuclear cell-derived Mγ-Mϕs. Mγ-Mϕs were differentiated from monocytes by 6 days of culture with M-CSF and IFNγ (control). Other stimuli were added on day 6; TGR5 agonist (1, 3·3 and 10 μm) in (d), and BAs including CA, DCA, CDCA, LCA and UDCA in (e). Cell viability was measured by PrestoBlue Cell Viability Reagent. Results are shown as the means ± SEM from each three independent experiments as relative percentages of the viability of Mγ-Mϕs stimulated with E. faecalis only. Statistical analysis was performed by Kruskal–Wallis one-way anova. (f) TNFα levels in Mγ-Mϕs culture supernatants were analysed after 24 hr stimulation with LPS (100 ng/ml) with or without the inflammatory agents as follows: TGR5 agonist, toll-like receptor (TLR) 4 inhibitor and p38 mitogen-activated protein kinase (MAPK) inhibitor. Results are shown as the means ± SEM from three independent experiments as relative percentages of TNFα levels in Mγ-Mϕs stimulated with LPS only. Statistical analysis was performed by Kruskal–Wallis one-way anova and the Bonferroni post-hoc test for multiple comparisons. **P < 0·01.
Figure 4
Figure 4
cAMP related to TGR5 as a second messenger suppresses tumour necrosis factor-α (TNF-α) production from macrophages differentiated with macrophage colony-stimulating factor (M-CSF) and interferon-γ (IFNγ) (Mγ-Mϕs) stimulated by Enterococcus faecalis or lipopolysaccharide (LPS). (a) Differentiated Mγ-Mϕs stimulated by E. faecalis (100 multiplicity of infection) on day 6 were treated with cAMP (10, 25 and 50 μm). TNF-α levels in culture supernatants were analysed after 24 hr of stimulation. Results are shown as the means ± SEM from four independent experiments as relative percentages of the TNF-α levels in Mγ-Mϕs stimulated with E. faecalis only. Statistical analysis was performed by Kruskal–Wallis one-way analysis of variance (anova) and the Bonferroni post-hoc test for multiple comparisons. **P < 0·01. (b) Similar TNF-α analysis as in (a) stimulated with LPS (100 ng/ml) with or without cAMP. Results are shown as the means ± SEM from six independent experiments as relative percentages of the TNF-α levels in Mγ-Mϕs stimulated with LPS only. Statistical analysis was performed by Kruskal–Wallis one-way anova and the Bonferroni post-hoc test for multiple comparisons. **P < 0·01. (c) Cell viability of Mγ-Mϕs modified by cAMP. Mγ-Mϕs were differentiated from monocytes by 6 days of culture with M-CSF and IFNγ (control). cAMP (10, 25 and 50 μm) was added on day 6. Cell viability was measured by PrestoBlue Cell Viability Reagent. Results are shown as the means ± SEM from each three independent experiments as relative percentages of the viability of Mγ-Mϕs stimulated with E. faecalis only. Statistical analysis was performed by Kruskal–Wallis one-way anova. (d) cAMP production in Mγ-Mϕs stimulated by the TGR5 agonist. Results are shown as the means ± SEM from five independent experiments. Statistical analysis was performed by the Student's t-test. *P < 0·05. (e) On day 6, Mγ-Mϕs were treated with the TGR5 agonist (10 μm) or control medium for 120 min and then stimulated by LPS (10 ng/ml) or control medium. Western blotting of c-Fos, p-c-Fos and β-actin at 0, 5, 15, 30 and 60 min is shown.
Figure 5
Figure 5
Lamina propria mononuclear cells (LPMCs) from patients with Crohn's disease CD express TGR5 similarly to that in macrophages differentiated with macrophage colony-stimulating factor (M-CSF) and interferon-γ (IFNγ) (Mγ-Mϕs). (a) The mRNA level of TGR5 in LPMCs of non-irritable bowel disease (non-IBD), non-inflamed Crohn's disease (CD) and inflamed CD patients was measured by real-time quantitative PCR. The mRNA level of TGR5 was normalized to that of β-actin and is shown as the fold change based on the non-IBD, which is set to 1. Results are shown as the means ± SEM from four non-IBD, seven non-inflamed CD and seven inflamed CD samples. Statistical analysis was performed by Kruskal–Wallis one-way analysis of variance and the Bonferroni post-hoc test for multiple comparisons. *P < 0·05. (b) The mRNA level of TGR5 in CD14+-depleted LPMCs and CD14+ intestinal Mϕs from CD patients was measured by real-time quantitative PCR. The mRNA level of TGR5 was normalized to that of β-actin, and is shown as the fold change based on the mRNA levels in CD whole LPMCs before sorting. Results are shown as the means ± SEM from four CD14+-depleted LPMCs and four CD14+ intestinal Mϕs samples. Statistical analysis was performed by Kruskal–Wallis one-way analysis of variance and the Bonferroni post-hoc test for multiple comparisons. *P < 0·05.
Figure 6
Figure 6
The TGR5 agonist suppresses tumour necrosis factor-α (TNF-α) production from the lamina propria mononuclear cells (LPMCs) and CD14+ intestinal macrophages (Mϕs) of patients with Crohn's disease (CD) in the same manner as that of macrophages differentiated with macrophage colony-stimulating factor (M-CSF) and interferon-γ (IFNγ) (Mγ-Mϕs) stimulated by Enterococcus faecalis. (a) TNF-α levels in CD LPMC culture supernatants were analysed after 24 hr stimulation with E. faecalis (multiplicity of infection = 100) with or without the TGR5 agonist (1, 3·3 and 10 μm). Results are shown as the means ± SEM from five independent experiments as relative percentages of TNF-α levels in LPMCs stimulated with E. faecalis only. Statistical analysis was performed by Kruskal–Wallis one-way analysis of variance and the Bonferroni post-hoc test for multiple comparisons. *P < 0·05, **P < 0·01. (b) CD14+ intestinal Mϕs of CD patients were analysed as described in (a). Results are shown as the means ± SEM from three independent experiments as relative percentages of TNF-α levels in CD14+ intestinal Mϕs stimulated with E. faecalis only. Statistical analysis was performed by Kruskal–Wallis one way analysis of variance and the Bonferroni post-hoc test for multiple comparisons. **P < 0·01.

Similar articles

Cited by

References

    1. Galli SJ, Borregaard N, Wynn TA. Phenotypic and functional plasticity of cells of innate immunity: macrophages, mast cells and neutrophils. Nat Immunol. 2011;12:1035–44. - PMC - PubMed
    1. Gordon S, Taylor PR. Monocyte and macrophage heterogeneity. Nat Rev Immunol. 2005;5:953–64. - PubMed
    1. Smythies LE, Sellers M, Clements RH, Mosteller-barnum M, Meng G, Benjamin WH, Orenstein JM, Smith PD. Human intestinal macrophages display profound inflammatory anergy despite avid phagocytic and bacteriocidal activity. J Clin Invest. 2005;115:66–75. - PMC - PubMed
    1. Kamada N, Hisamatsu T, Okamoto S, et al. Abnormally differentiated subsets of intestinal macrophage play a key role in Th1-dominant chronic colitis through excess production of IL-12 and IL-23 in response to bacteria. J Immunol. 2005;175:6900–8. - PubMed
    1. Takada Y, Hisamatsu T, Kamada N, et al. Monocyte chemoattractant protein-1 contributes to gut homeostasis and intestinal inflammation by composition of IL-10-producing regulatory macrophage subset. J Immunol. 2010;184:2671–6. - PubMed

Publication types

MeSH terms