

Succinate dehydrogenase mutation underlies global epigenomic divergence in gastrointestinal stromal tumor
- PMID: 23550148
- PMCID: PMC4135374
- DOI: 10.1158/2159-8290.CD-13-0092
Succinate dehydrogenase mutation underlies global epigenomic divergence in gastrointestinal stromal tumor
Abstract
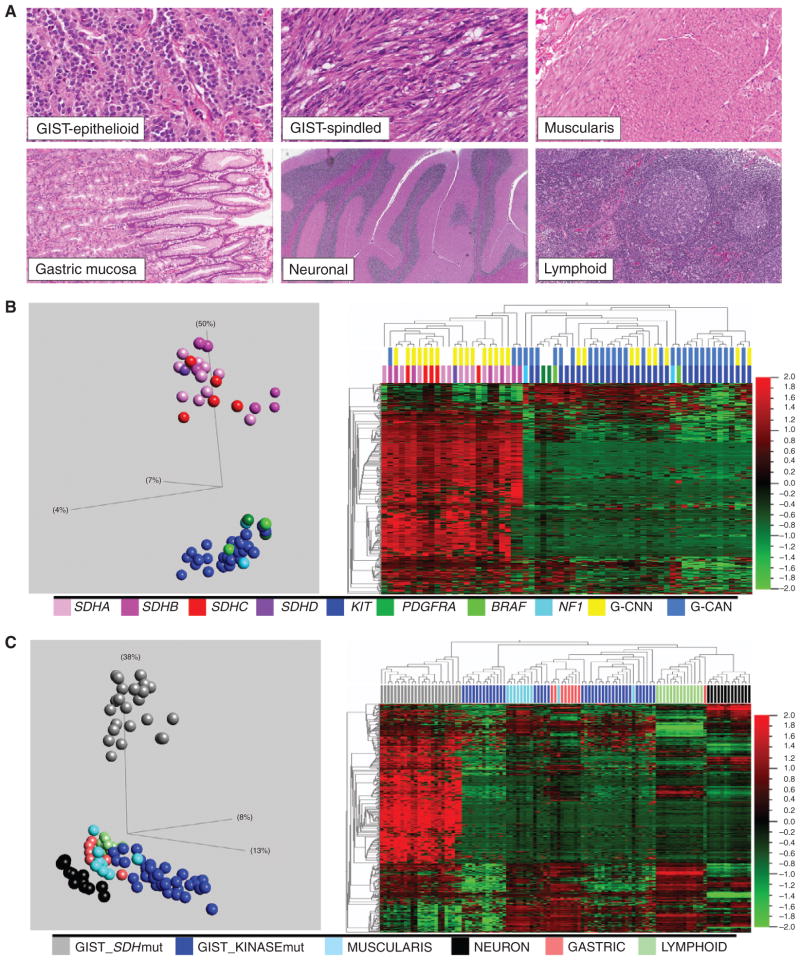
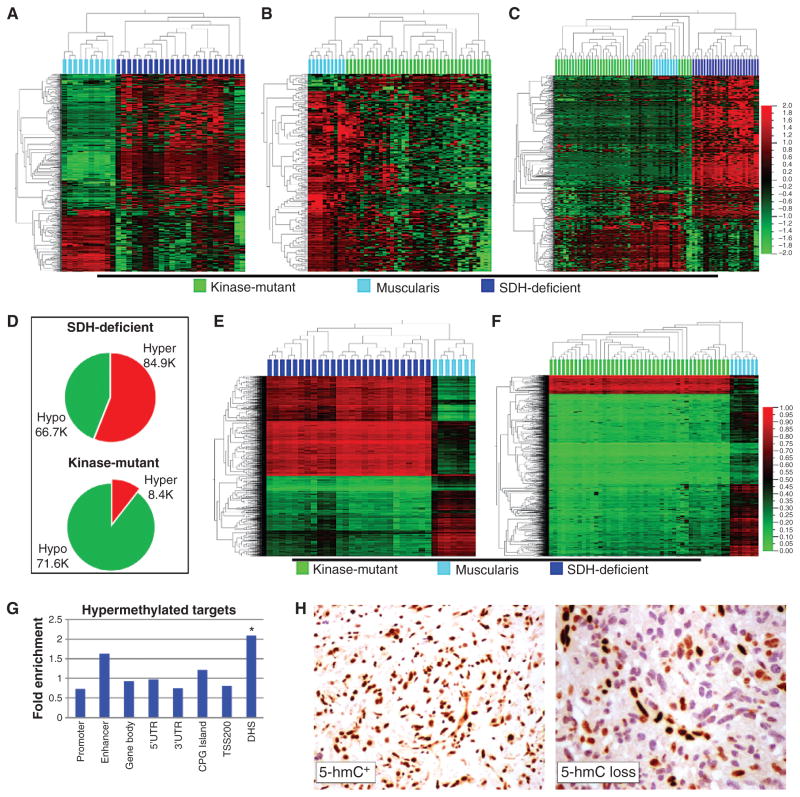
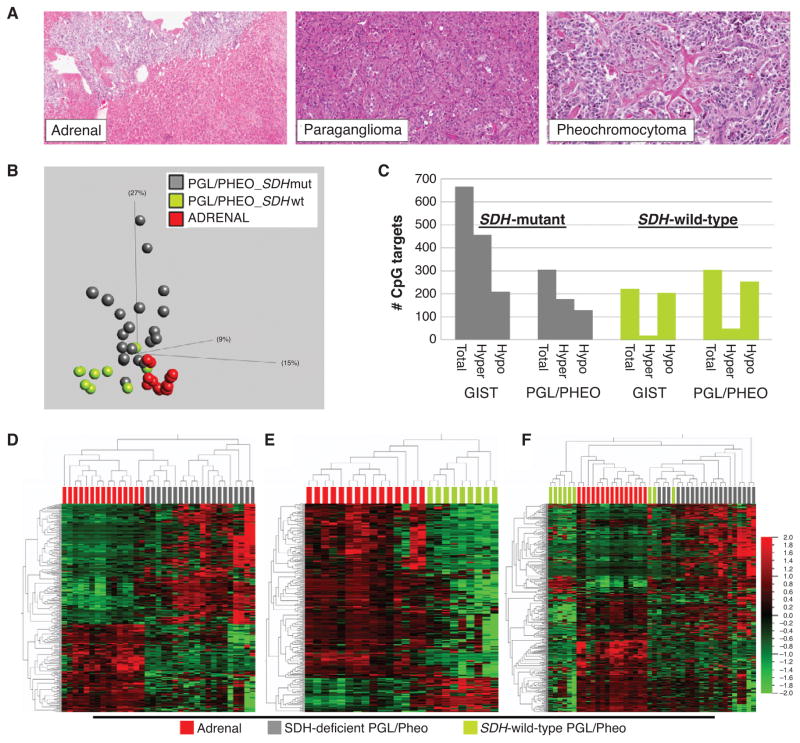
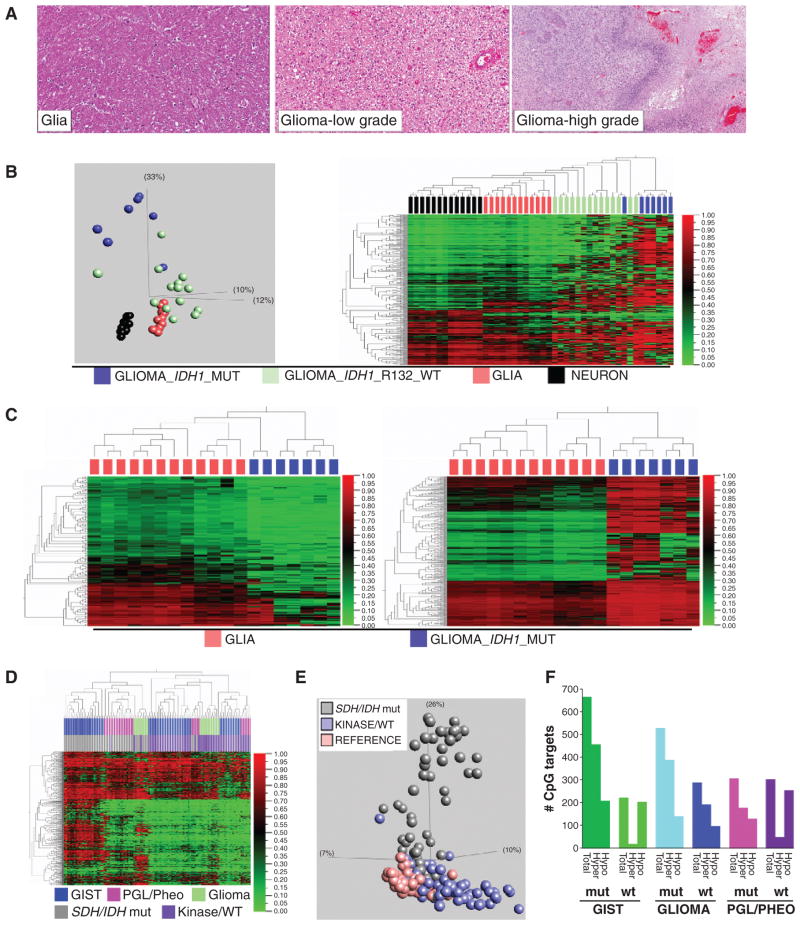
Gastrointestinal stromal tumors (GIST) harbor driver mutations of signal transduction kinases such as KIT, or, alternatively, manifest loss-of-function defects in the mitochondrial succinate dehydrogenase (SDH) complex, a component of the Krebs cycle and electron transport chain. We have uncovered a striking divergence between the DNA methylation profiles of SDH-deficient GIST (n = 24) versus KIT tyrosine kinase pathway-mutated GIST (n = 39). Infinium 450K methylation array analysis of formalin-fixed paraffin-embedded tissues disclosed an order of magnitude greater genomic hypermethylation relative to SDH-deficient GIST versus the KIT-mutant group (84.9 K vs. 8.4 K targets). Epigenomic divergence was further found among SDH-mutant paraganglioma/pheochromocytoma (n = 29), a developmentally distinct SDH-deficient tumor system. Comparison of SDH-mutant GIST with isocitrate dehydrogenase-mutant glioma, another Krebs cycle-defective tumor type, revealed comparable measures of global hypo- and hypermethylation. These data expose a vital connection between succinate metabolism and genomic DNA methylation during tumorigenesis, and generally implicate the mitochondrial Krebs cycle in nuclear epigenomic maintenance.
Conflict of interest statement
B. Klotzle and M. Bibikova are employees of Illumina, Inc. J.D. Schiffman is a consultant/advisory board member of Affymetrix, Inc. J.-B. Fan is an employee of Illumina, Inc. No potential conflicts of interest were disclosed by the other authors.
Figures
Comment in
-
Metabolism: Epigenetic links to the web of Krebs.Nat Rev Cancer. 2013 Jul;13(7):437. doi: 10.1038/nrc3551. Epub 2013 Jun 20. Nat Rev Cancer. 2013. PMID: 23783118 No abstract available.
Similar articles
-
Defects in succinate dehydrogenase in gastrointestinal stromal tumors lacking KIT and PDGFRA mutations.Proc Natl Acad Sci U S A. 2011 Jan 4;108(1):314-8. doi: 10.1073/pnas.1009199108. Epub 2010 Dec 20. Proc Natl Acad Sci U S A. 2011. PMID: 21173220 Free PMC article.
-
Succinate dehydrogenase deficiency is associated with decreased 5-hydroxymethylcytosine production in gastrointestinal stromal tumors: implications for mechanisms of tumorigenesis.Mod Pathol. 2013 Nov;26(11):1492-7. doi: 10.1038/modpathol.2013.86. Epub 2013 Jun 7. Mod Pathol. 2013. PMID: 23743927
-
Molecular Subtypes of KIT/PDGFRA Wild-Type Gastrointestinal Stromal Tumors: A Report From the National Institutes of Health Gastrointestinal Stromal Tumor Clinic.JAMA Oncol. 2016 Jul 1;2(7):922-8. doi: 10.1001/jamaoncol.2016.0256. JAMA Oncol. 2016. PMID: 27011036 Free PMC article.
-
Succinate dehydrogenase deficient gastrointestinal stromal tumors (GISTs) - a review.Int J Biochem Cell Biol. 2014 Aug;53:514-9. doi: 10.1016/j.biocel.2014.05.033. Epub 2014 Jun 2. Int J Biochem Cell Biol. 2014. PMID: 24886695 Free PMC article. Review.
-
Current management of succinate dehydrogenase-deficient gastrointestinal stromal tumors.Cancer Metastasis Rev. 2019 Sep;38(3):525-535. doi: 10.1007/s10555-019-09818-0. Cancer Metastasis Rev. 2019. PMID: 31773431 Free PMC article. Review.
Cited by
-
Kidney tumors associated with germline mutations of FH and SDHB show a CpG island methylator phenotype (CIMP).PLoS One. 2022 Dec 1;17(12):e0278108. doi: 10.1371/journal.pone.0278108. eCollection 2022. PLoS One. 2022. PMID: 36455002 Free PMC article.
-
Metabolism: Epigenetic links to the web of Krebs.Nat Rev Cancer. 2013 Jul;13(7):437. doi: 10.1038/nrc3551. Epub 2013 Jun 20. Nat Rev Cancer. 2013. PMID: 23783118 No abstract available.
-
Preferential MGMT hypermethylation in SDH-deficient wild-type GIST.J Clin Pathol. 2023 Dec 14;77(1):34-39. doi: 10.1136/jcp-2022-208462. J Clin Pathol. 2023. PMID: 36198483 Free PMC article.
-
Altered chromosomal topology drives oncogenic programs in SDH-deficient GISTs.Nature. 2019 Nov;575(7781):229-233. doi: 10.1038/s41586-019-1668-3. Epub 2019 Oct 16. Nature. 2019. PMID: 31666694 Free PMC article.
-
Lack of Major Genome-Wide DNA Methylation Changes in Succinate-Treated Human Epithelial Cells.Int J Mol Sci. 2022 May 18;23(10):5663. doi: 10.3390/ijms23105663. Int J Mol Sci. 2022. PMID: 35628470 Free PMC article.
References
-
- Hirota S, Isozaki K, Moriyama Y, Hashimoto K, Nishida T, Ishiguro S, et al. Gain-of-function mutations of c-kit in human gastrointestinal stromal tumors. Science. 1998;279:577–80. - PubMed
-
- Pantaleo MA, Astolfi A, Indio V, Moore R, Thiessen N, Heinrich MC, et al. SDHA loss-of-function mutations in KIT-PDGFRA wild-type gastrointestinal stromal tumors identified by massively parallel sequencing. J Natl Cancer Inst. 2011;103:983–7. - PubMed
Publication types
MeSH terms
Substances
Grants and funding
LinkOut - more resources
Full Text Sources
Other Literature Sources
Molecular Biology Databases
